| Start Page |
|
 |
| Start Page |
|
|
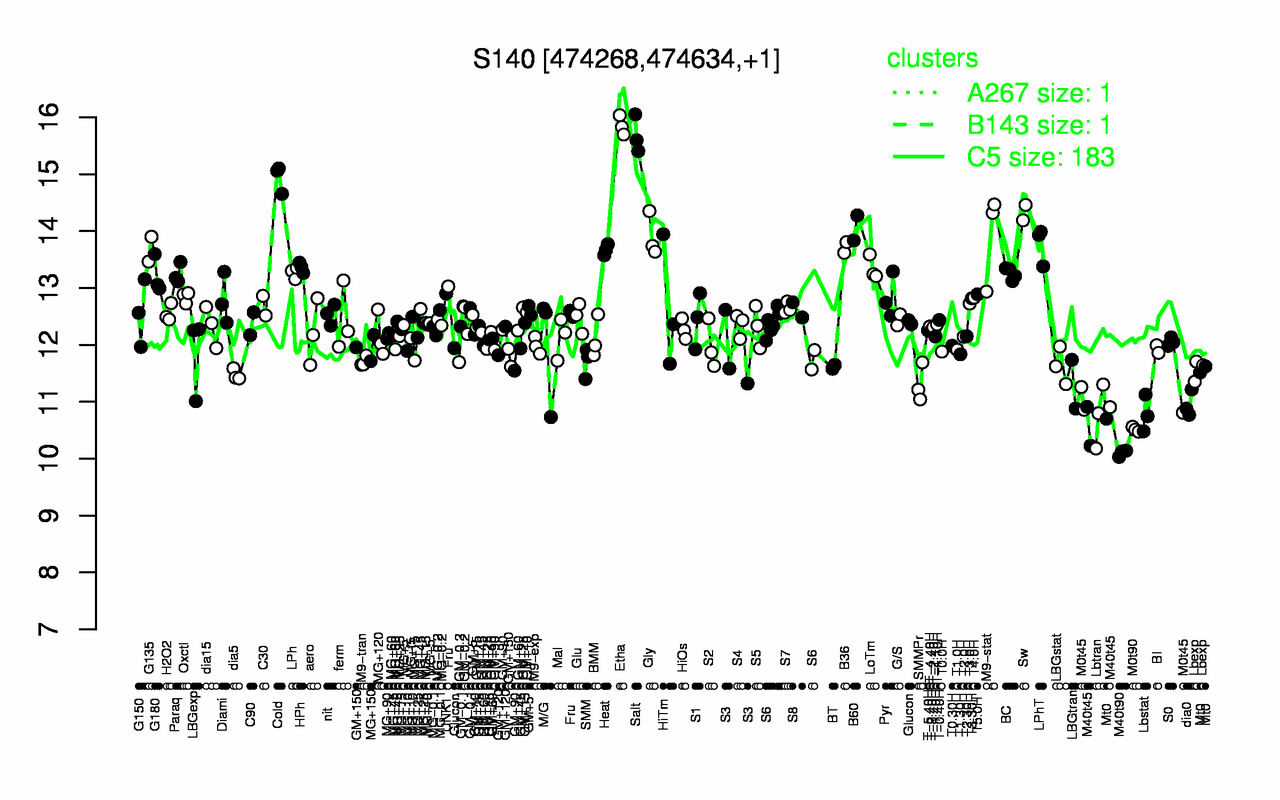
| Etha | Salt | Cold | Sw | B60 | Gly | M9-stat | LPhT | B36 | G135 |
| 15.9 | 15.7 | 14.9 | 14.3 | 14.1 | 13.9 | 13.9 | 13.8 | 13.7 | 13.7 |
| M40t90 | M0t90 | M40t45 | Lbtran | Lbstat | dia0 | M0t45 | Mt0 | LBGtran | SMMPr |
| 10.1 | 10.5 | 10.7 | 10.8 | 10.8 | 11 | 11 | 11.3 | 11.3 | 11.3 |