| Start Page |
|
 |
| Start Page |
|
|
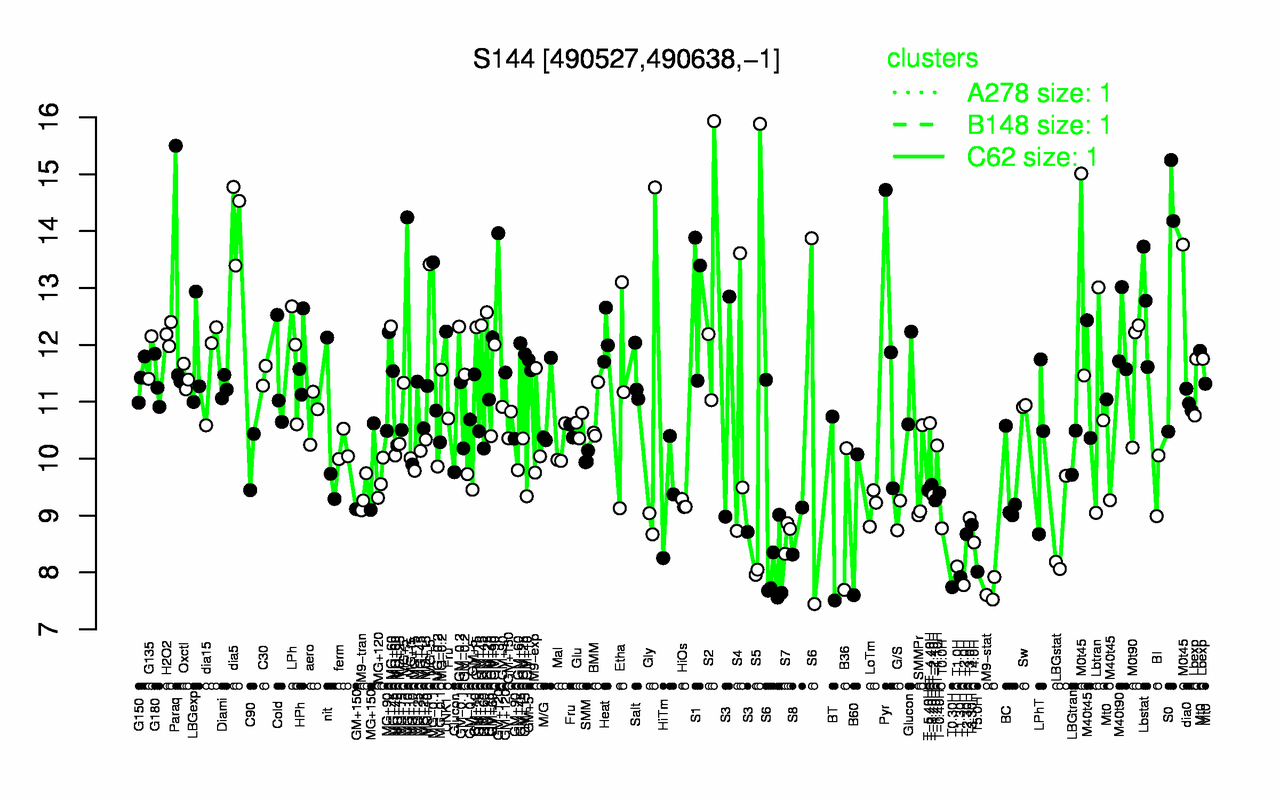
| dia5 | M0t45 | S0 | S2 | S1 | Paraq | GM+120 | Lbstat | MG+5 | UNK1 |
| 14.2 | 13.4 | 13.3 | 13.1 | 12.9 | 12.8 | 12.7 | 12.7 | 12.4 | 12.2 |
| M9-stat | T0.30H | T2.0H | T1.30H | T5.0H | T1.0H | T4.0H | LBGstat | S7 | T2.30H |
| 7.68 | 7.74 | 7.78 | 7.92 | 8.01 | 8.1 | 8.53 | 8.65 | 8.65 | 8.67 |