B. subtilis Expression Data Browser
Details about S1453 Show/Hide
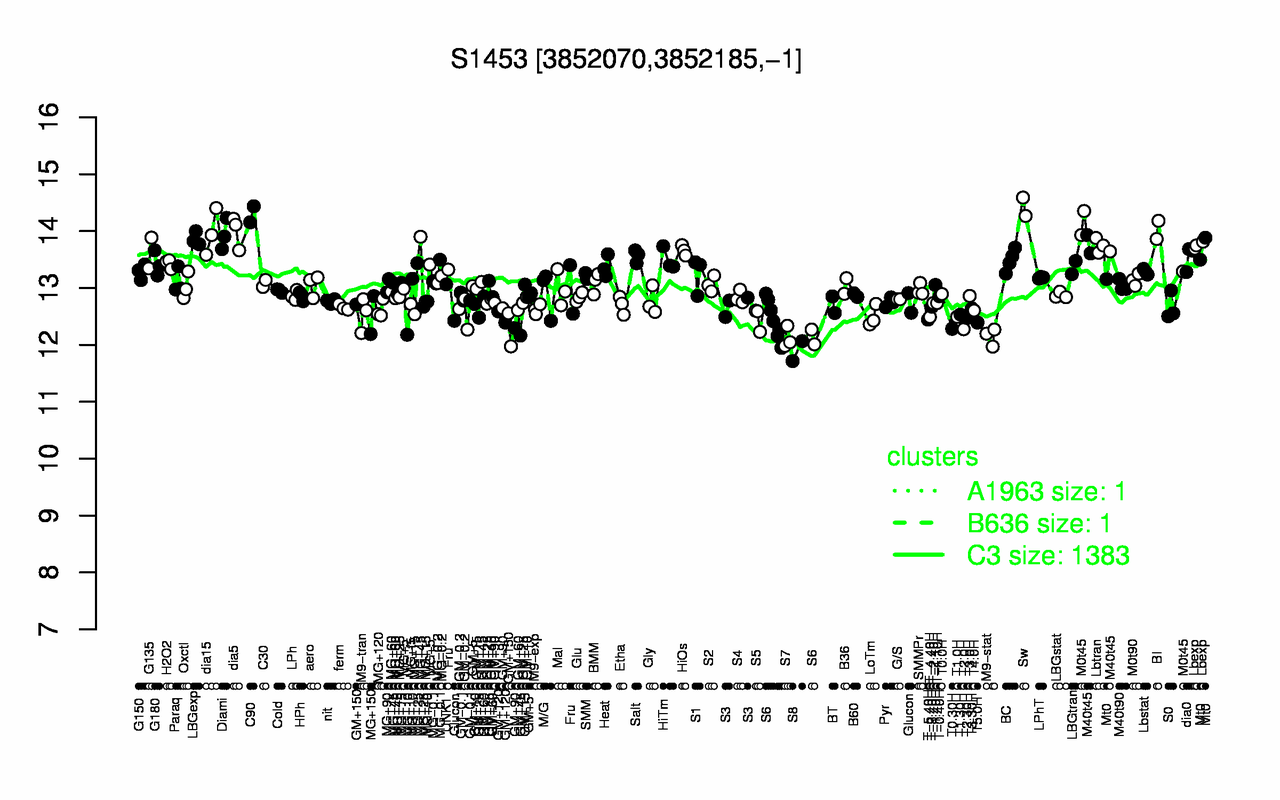
Highest Expression Conditions
Sw C90 BI dia5 dia15 Diami LBGexp M0t45 Lbexp Lbtran
14.4 14.3 14 14 14 13.9 13.9 13.9 13.8 13.7
Lowest Expression Conditions
S8 S7 M9-stat T2.0H T0.30H S6 T5.0H GM+150 T-5.40H T2.30H
11.9 12.1 12.1 12.3 12.3 12.4 12.4 12.4 12.4 12.5
Most Positively Correlated Segments
ywhD ppnKA ywhC yjbO ytpR ftsH gltX ecsB mutM moaD
0.78 0.71 0.7 0.69 0.68 0.67 0.67 0.67 0.66 0.66
Most Negatively Correlated Segments
S1055 safA S1056 coxA nadA S383 yisI argJ argC argB
-0.65 -0.65 -0.63 -0.61 -0.61 -0.6 -0.59 -0.59 -0.58 -0.58
Expression Profile of Segment S1453 Show/Hide
Genomic View of Gene/Segment S1453 Show/Hide
(Legend)