| Start Page |
|
 |
| Start Page |
|
|
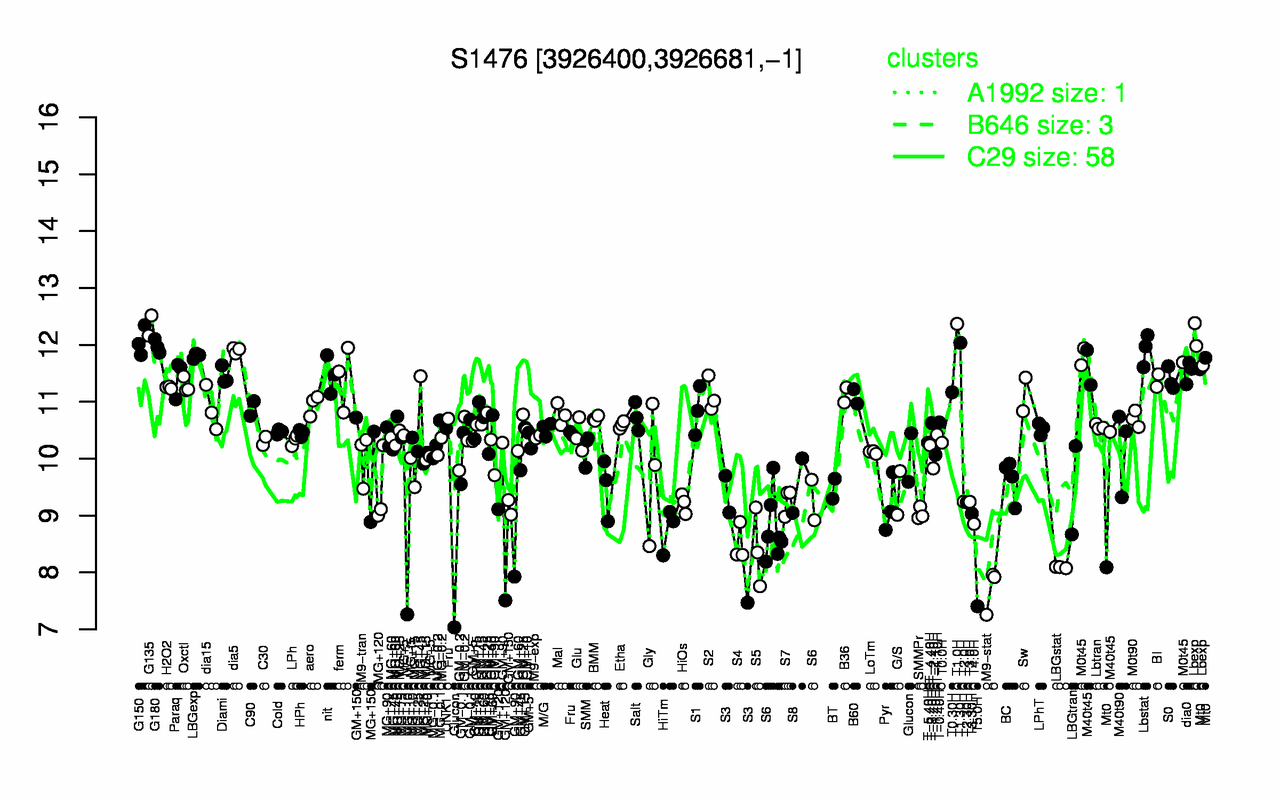
| T1.0H | G135 | G150 | T1.30H | Lbexp | G180 | Lbstat | dia5 | LBGexp | M0t45 |
| 12.4 | 12.3 | 12.1 | 12 | 12 | 12 | 11.9 | 11.9 | 11.8 | 11.8 |
| T5.0H | M9-stat | LBGstat | GM+120 | S5 | S4 | S3 | HiTm | T4.0H | S6 |
| 7.41 | 7.71 | 8.09 | 8.31 | 8.42 | 8.5 | 8.74 | 8.75 | 8.85 | 8.87 |