| Start Page |
|
 |
| Start Page |
|
|
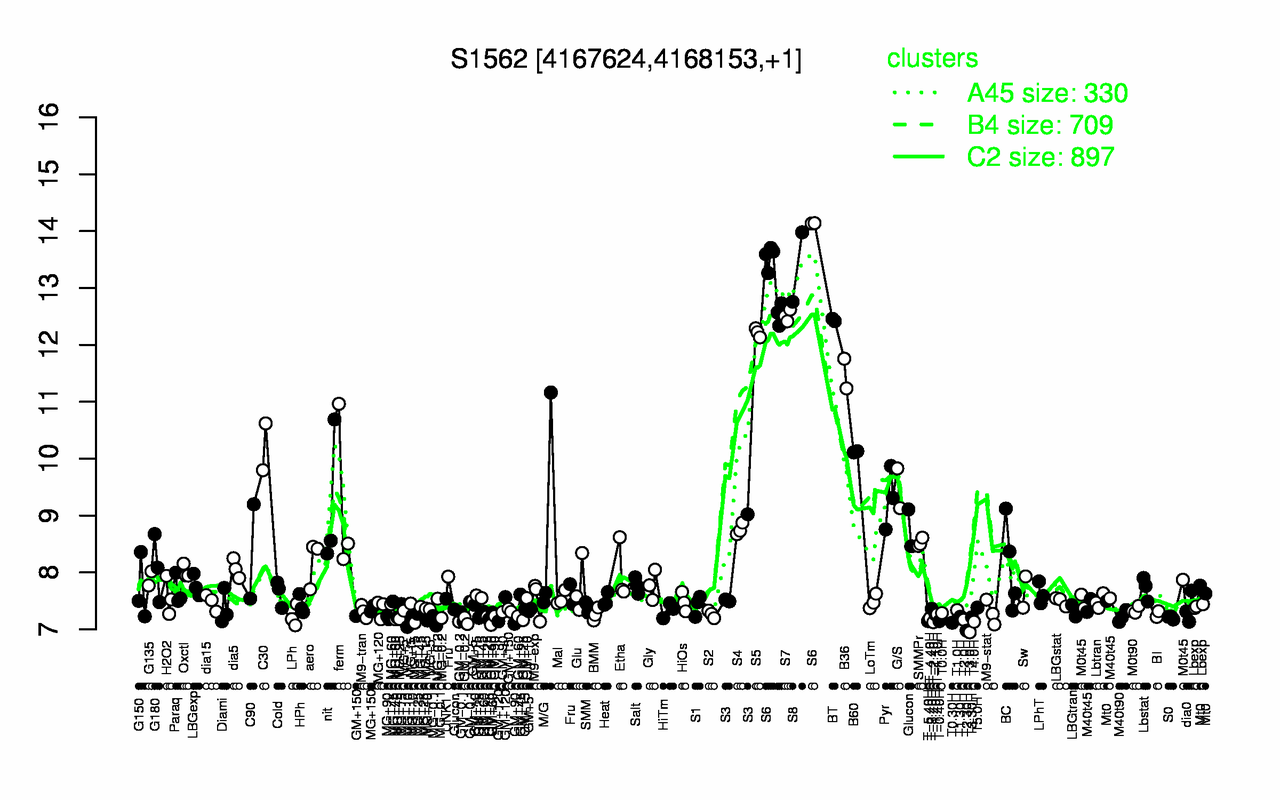
| S8 | S6 | S7 | BT | S5 | B36 | C30 | B60 | G/S | Pyr |
| 13.4 | 13.3 | 12.5 | 12.4 | 12.2 | 11.5 | 10.2 | 10.1 | 9.48 | 9.31 |
| T3.0H | T2.30H | T0.30H | T-2.40H | T4.0H | T-0.40H | T-5.40H | GM-0.2 | MG+10 | MG-0.1 |
| 6.95 | 6.98 | 7.12 | 7.12 | 7.13 | 7.14 | 7.15 | 7.15 | 7.15 | 7.16 |