B. subtilis Expression Data Browser
Start Page
B. subtilis Expression Data Browser
Gene/Segment:
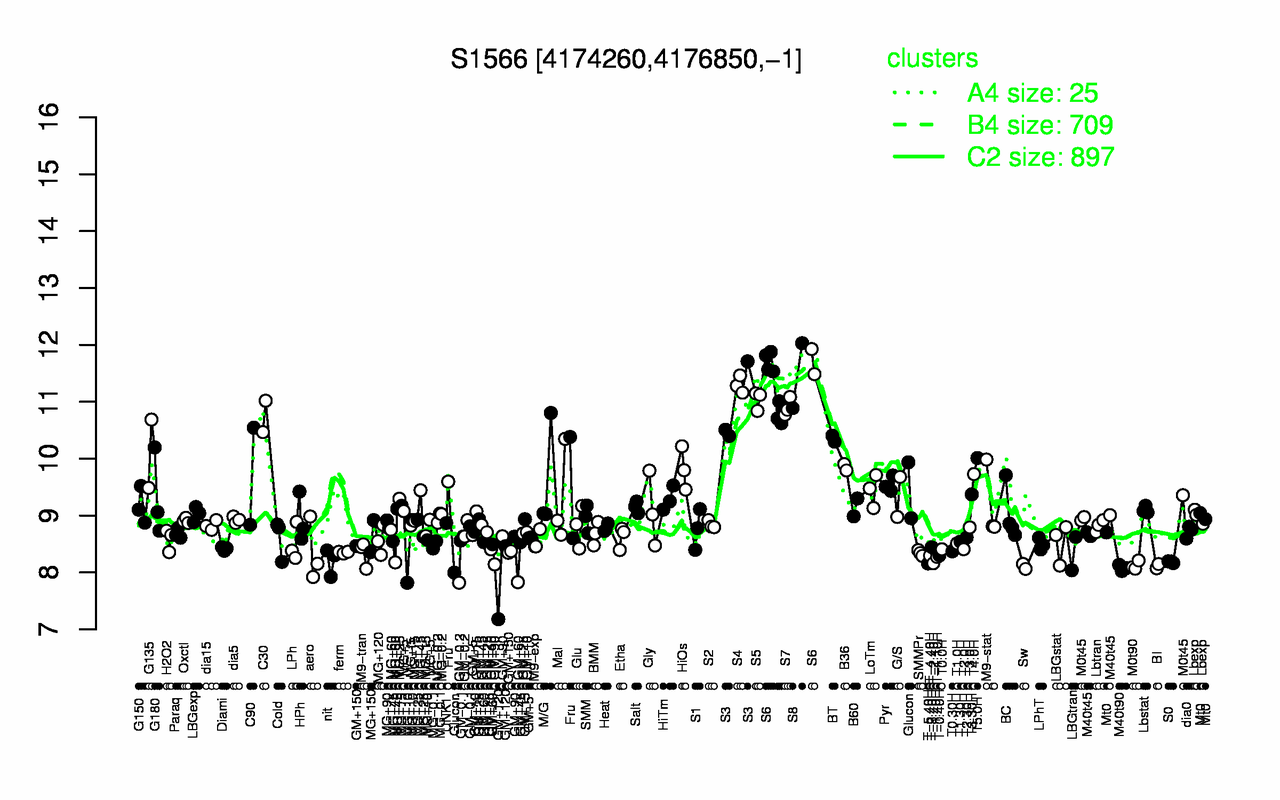
S1566
Locus Tag:
new_4174260_4176850_c
Details about S1566
Show/Hide
Highest Expression Conditions
S8
S6
S4
S5
S7
S3
C30
BT
G135
T5.0H
11.5
11.4
11.3
11
10.9
10.9
10.7
10.4
10.1
10
Lowest Expression Conditions
GM+120
M40t90
Sw
BI
M0t90
T-5.40H
T-2.40H
S0
nit
T-1.10H
7.82
8.08
8.11
8.11
8.12
8.16
8.16
8.18
8.2
8.27
Most Positively Correlated Segments
S526
S546
S1420
S13
S601
S869
S882
S265
S416
S354
0.89
0.89
0.88
0.88
0.87
0.87
0.87
0.86
0.86
0.86
Most Negatively Correlated Segments
kinC
bceR
ptkA
addA
yusH
bceS
addB
ydiR
yugH
yugG
-0.75
-0.75
-0.74
-0.72
-0.72
-0.72
-0.72
-0.72
-0.72
-0.71
Expression Profile of Segment S1566
Show/Hide
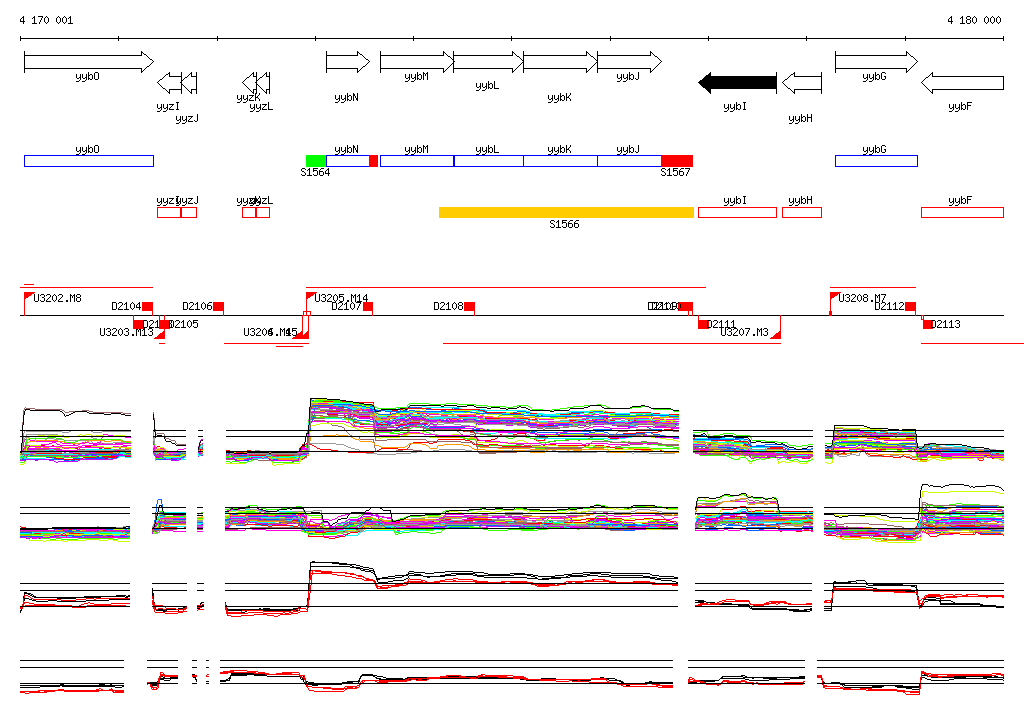
Genomic View of Gene/Segment S1566
Show/Hide
(Legend)
Browse Genome Context