| Start Page |
|
 |
| Start Page |
|
|
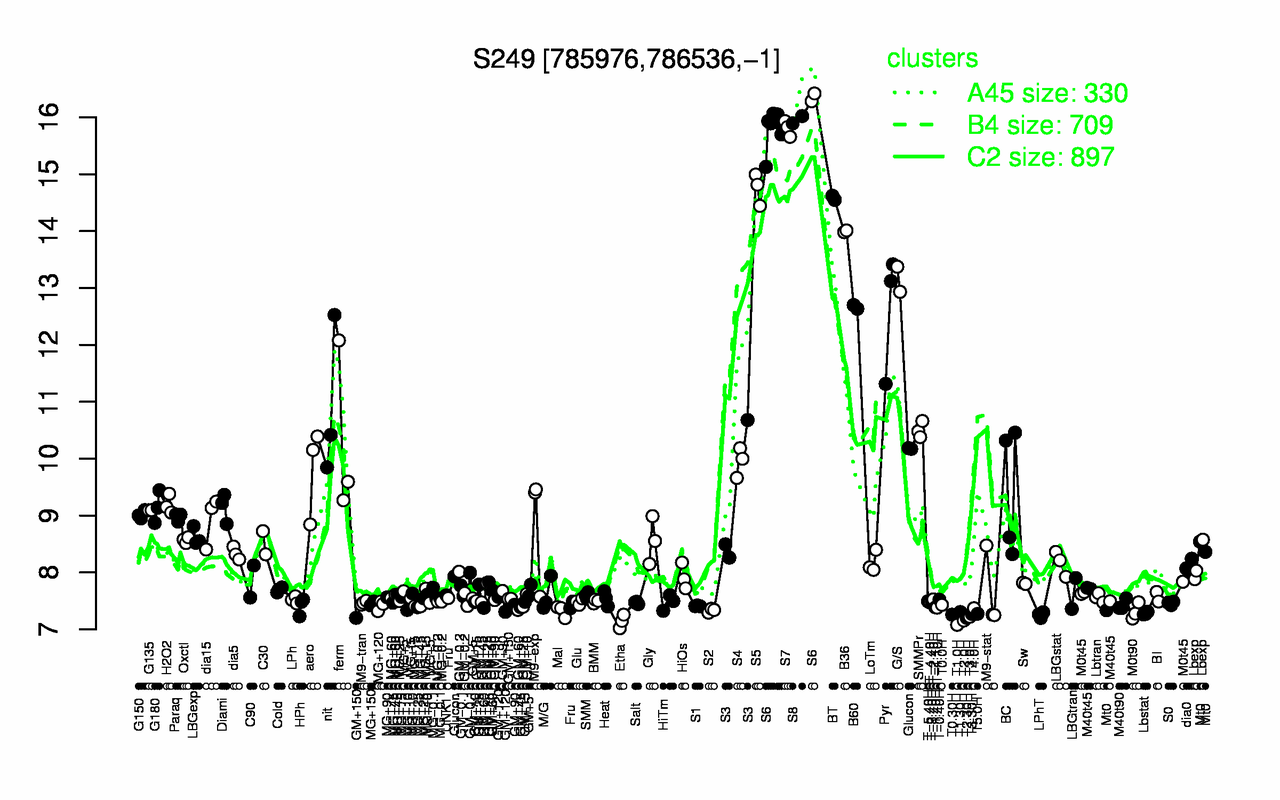
| S8 | S6 | S7 | S5 | BT | B36 | G/S | B60 | Pyr | nit |
| 16 | 15.9 | 15.8 | 14.8 | 14.6 | 14 | 13.2 | 12.7 | 12.6 | 10.9 |
| T1.0H | Etha | T2.0H | T2.30H | T3.0H | LPhT | T0.30H | T3.30H | T5.0H | Lbstat |
| 7.08 | 7.14 | 7.15 | 7.2 | 7.22 | 7.25 | 7.26 | 7.27 | 7.27 | 7.28 |