B. subtilis Expression Data Browser
Start Page
B. subtilis Expression Data Browser
Gene/Segment:
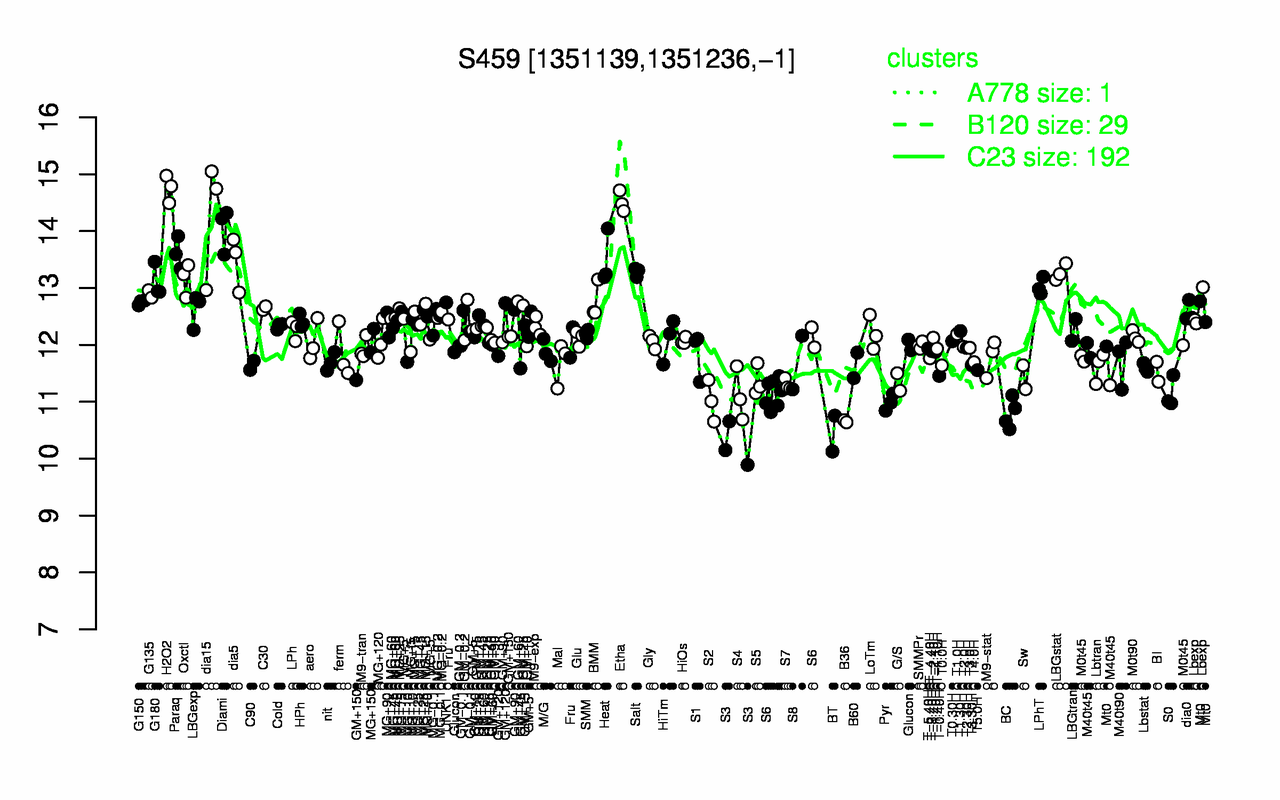
S459
Locus Tag:
new_1351139_1351236_c
Details about S459
Show/Hide
Highest Expression Conditions
H2O2
Etha
dia15
Diami
Paraq
Heat
dia5
Salt
LBGstat
Oxctl
14.8
14.5
14.3
14
13.6
13.5
13.5
13.3
13.3
13.2
Lowest Expression Conditions
S3
BT
B36
BC
Pyr
S2
S4
S0
S7
G/S
10.2
10.4
10.7
10.8
11
11
11.1
11.2
11.3
11.3
Most Positively Correlated Segments
yqaB
ebrA
yyzM
S911
yclA
coaX
S59
ydgJ
ykvT
ydeP
0.8
0.79
0.78
0.78
0.77
0.77
0.77
0.77
0.77
0.77
Most Negatively Correlated Segments
ctaC
ctaD
ymaH
yqjU
ctaF
yqjV
ctaG
S544
ctaE
S1111
-0.74
-0.73
-0.73
-0.73
-0.73
-0.73
-0.72
-0.72
-0.72
-0.71
Expression Profile of Segment S459
Show/Hide
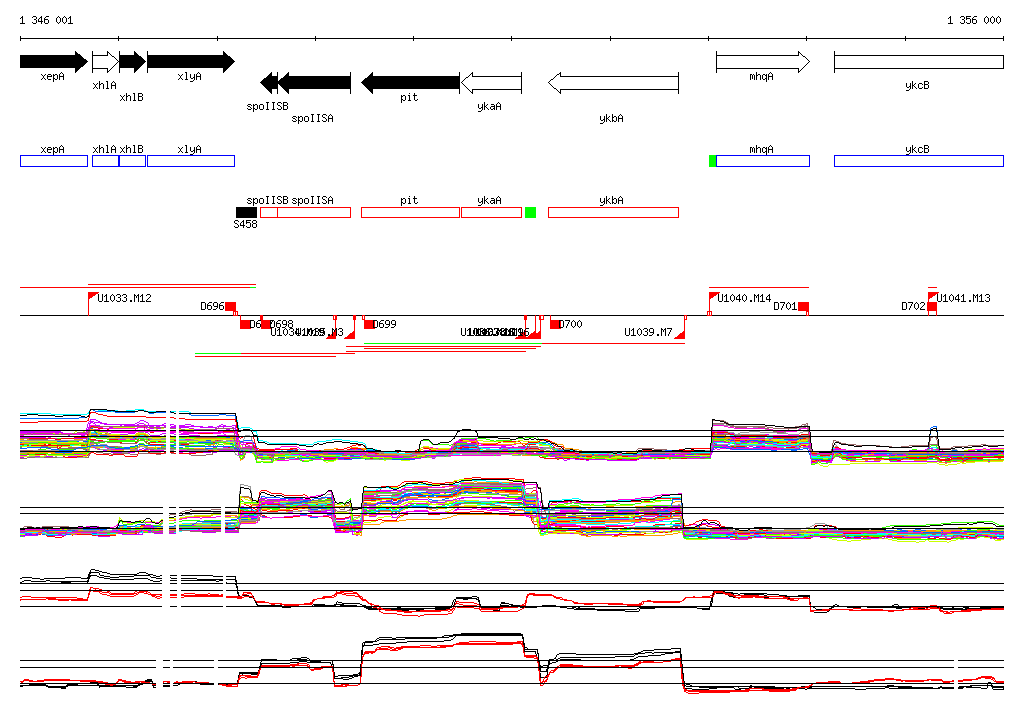
Genomic View of Gene/Segment S459
Show/Hide
(Legend)
Browse Genome Context