| Start Page |
|
 |
| Start Page |
|
|
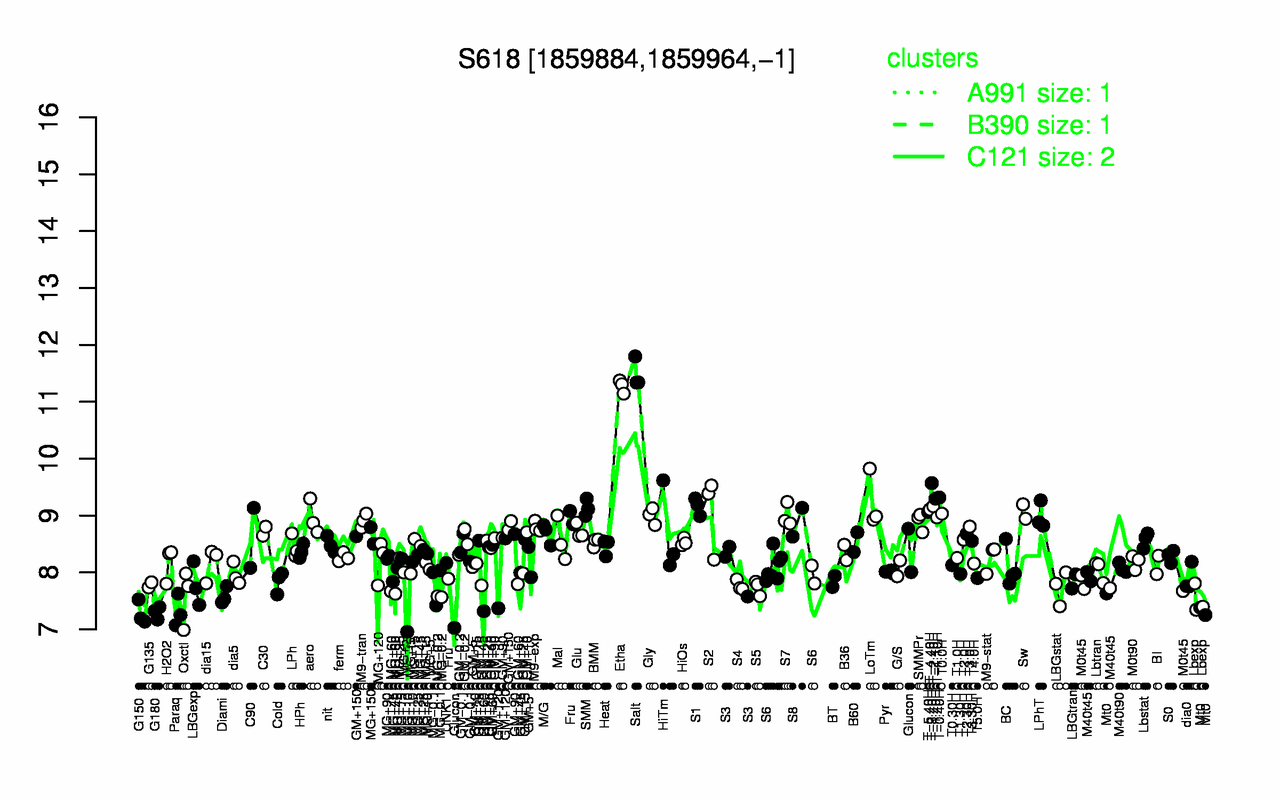
| Salt | Etha | T-3.40H | T-0.40H | T-1.40H | LoTm | T-2.40H | S1 | SMM | T-4.40H |
| 11.5 | 11.3 | 9.57 | 9.32 | 9.29 | 9.25 | 9.16 | 9.16 | 9.13 | 9.11 |
| G150 | G180 | Paraq | Mt0 | Lbexp | MG-0.2 | Oxctl | Diami | MG+60 | LBGstat |
| 7.28 | 7.3 | 7.32 | 7.42 | 7.52 | 7.57 | 7.58 | 7.59 | 7.65 | 7.74 |