| Start Page |
|
 |
| Start Page |
|
|
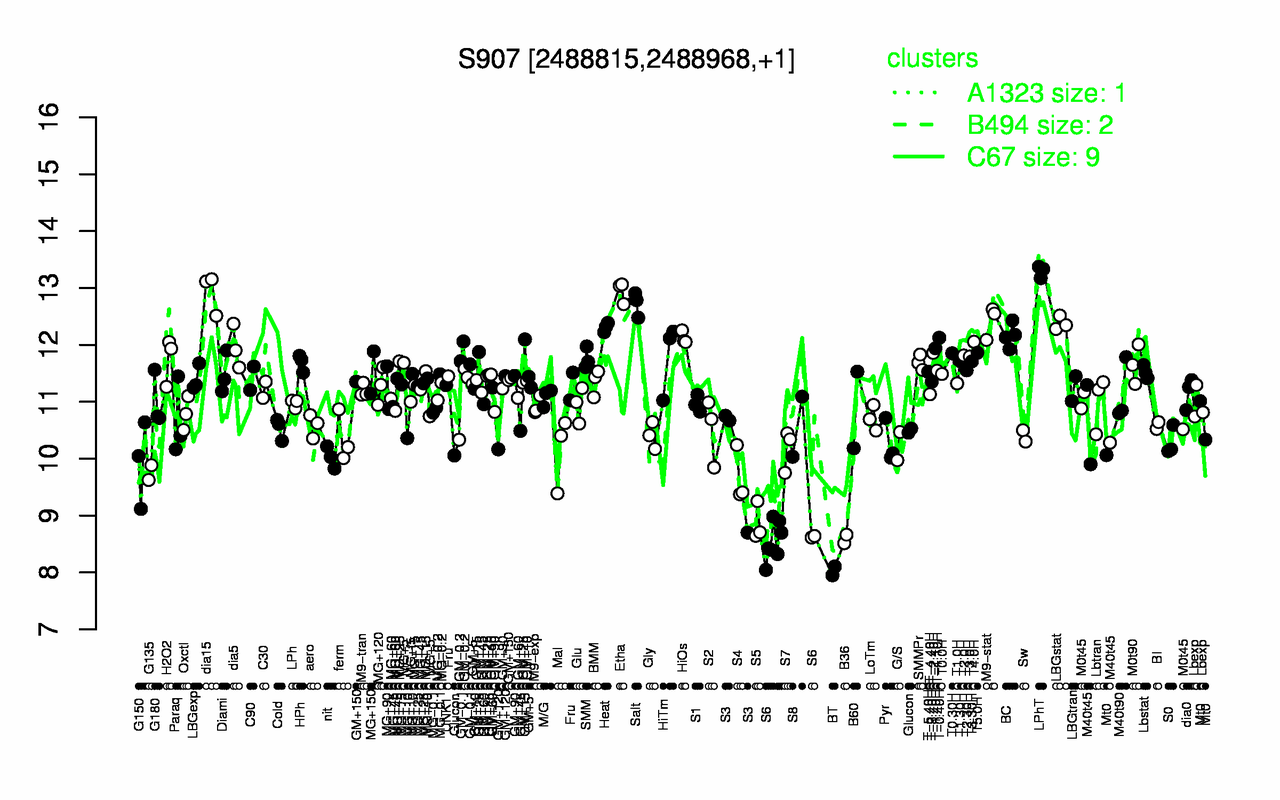
| LPhT | Etha | dia15 | Salt | M9-stat | LBGstat | Heat | BC | T-0.40H | HiOs |
| 13.3 | 12.9 | 12.9 | 12.7 | 12.4 | 12.4 | 12.3 | 12.2 | 12.1 | 12.1 |
| BT | S6 | B36 | S5 | S4 | G135 | G150 | nit | S3 | Mal |
| 8.03 | 8.56 | 8.59 | 8.87 | 9.67 | 9.76 | 9.93 | 10 | 10 | 10.1 |