| Start Page |
|
 |
| Start Page |
|
|
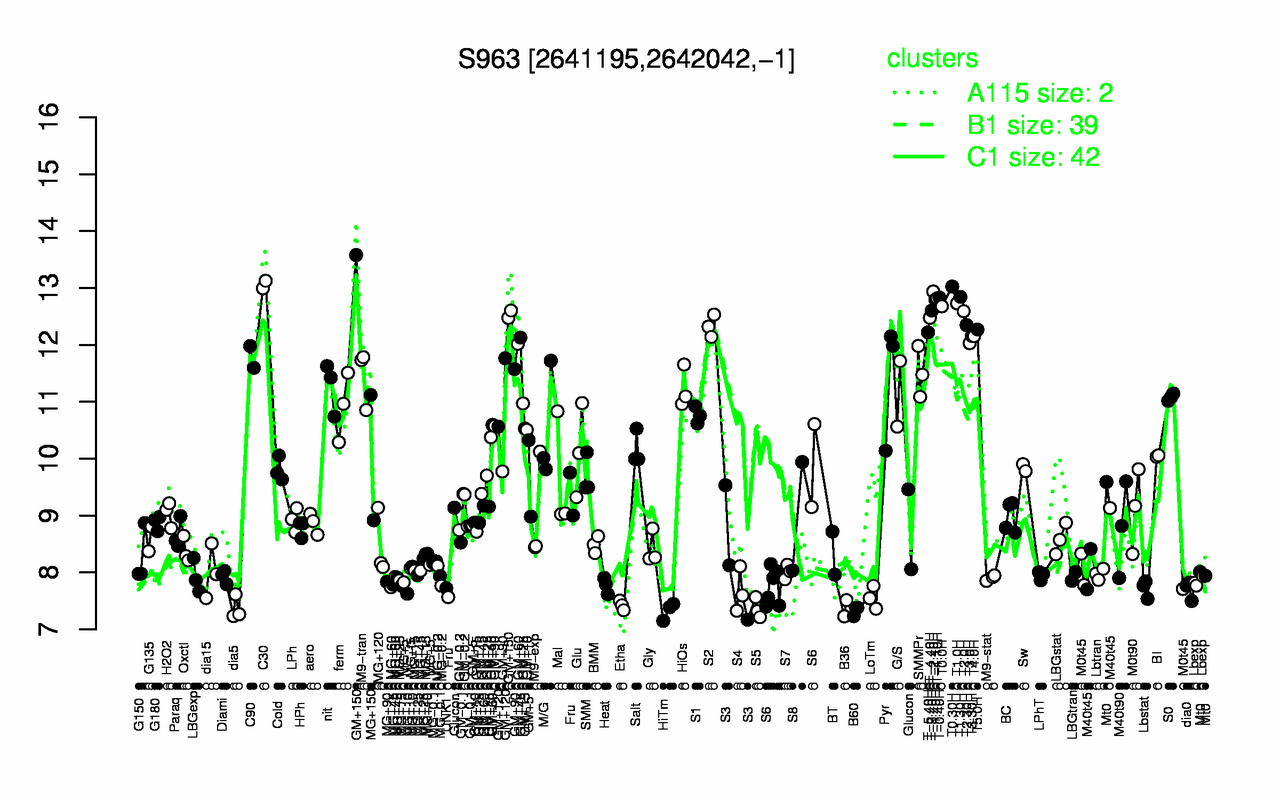
| C30 | T0.30H | T-2.40H | GM+150 | T1.30H | T-0.40H | T-1.10H | T-1.40H | T1.0H | T0.0H |
| 13.1 | 13 | 12.9 | 12.9 | 12.8 | 12.8 | 12.8 | 12.8 | 12.7 | 12.7 |
| B60 | HiTm | S5 | B36 | dia5 | Etha | LoTm | S4 | dia0 | Lbstat |
| 7.31 | 7.33 | 7.37 | 7.37 | 7.37 | 7.42 | 7.56 | 7.68 | 7.7 | 7.72 |