B. subtilis Expression Data Browser
Start Page
B. subtilis Expression Data Browser
Gene/Segment:
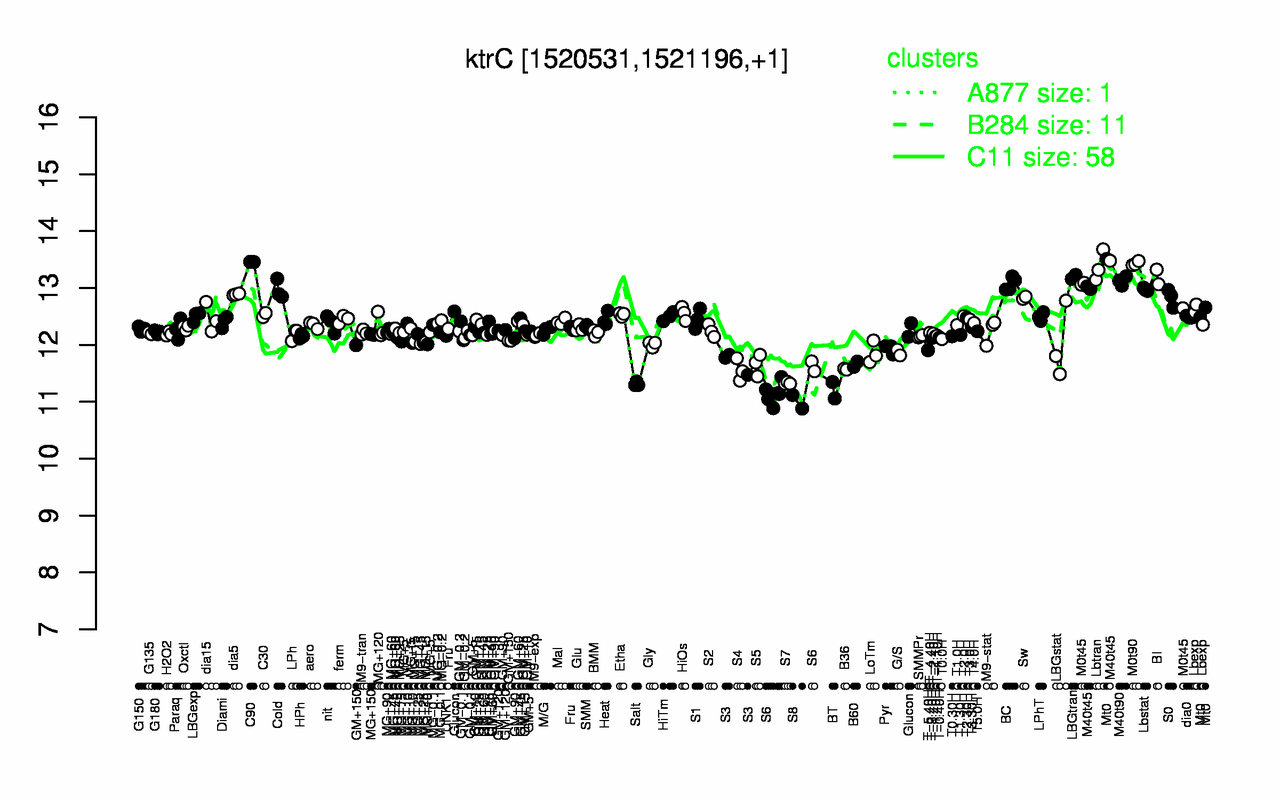
ktrC
Locus Tag:
BSU14510
Details about ktrC
Show/Hide
Highest Expression Conditions
C90
M0t90
Lbtran
BI
LBGtran
M40t45
M40t90
BC
Lbstat
Cold
13.5
13.4
13.4
13.2
13.2
13.2
13.1
13.1
13
13
Lowest Expression Conditions
S8
BT
S6
Salt
S7
S4
B36
S5
B60
S3
11
11.2
11.3
11.3
11.3
11.6
11.6
11.7
11.7
11.7
Most Positively Correlated Segments
ywjH
yvfU
bceS
yvfT
bceR
S1438
yfmR
yqjT
yfjP
lexA
0.8
0.79
0.79
0.78
0.76
0.76
0.75
0.75
0.75
0.75
Most Negatively Correlated Segments
proJ
proH
nucB
coxA
S1055
yqfC
spsL
S1289
yqfD
csfB
-0.74
-0.72
-0.7
-0.69
-0.69
-0.68
-0.68
-0.68
-0.68
-0.67
Expression Profile of Segment ktrC
Show/Hide
Annotation of Gene ktrC
Show/Hide
function
16.1: Circulate
inference
ab initio prediction:AMIGene:2.0
codon_start
1
product
potassium uptake protein
transl_table
11
note
Evidence 1a: Function experimentally demonstrated in the studied strain; PubMedId: 12562800, 15096624; Product type t: transporter
db_xref
GI:2633822
protein_id
CAB13324.1
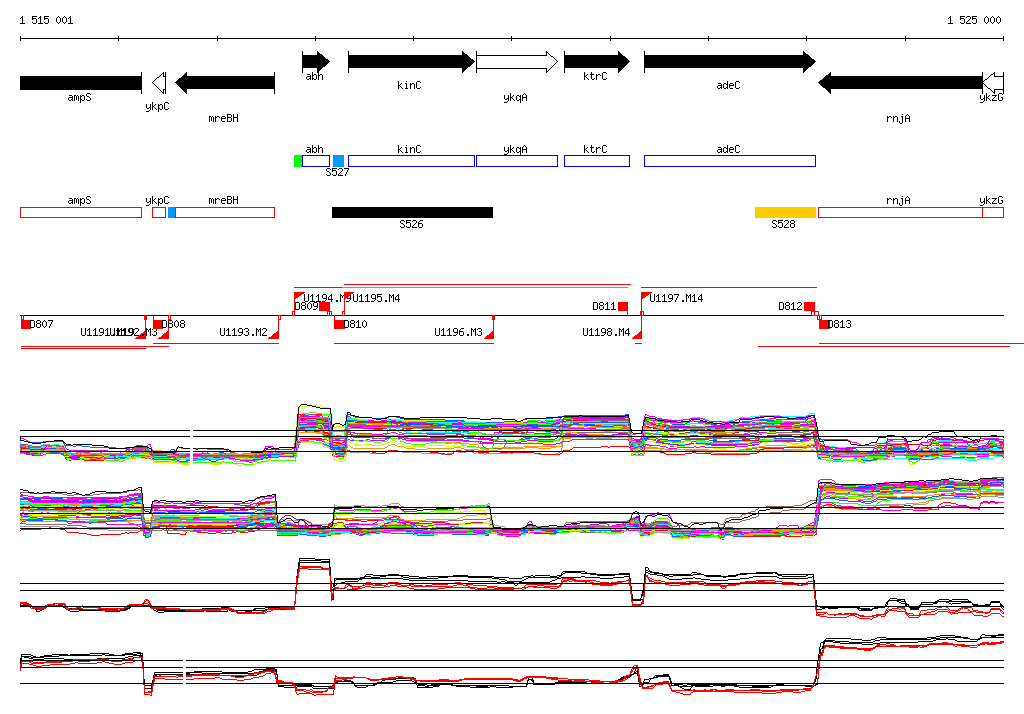
Genomic View of Gene/Segment ktrC
Show/Hide
(Legend)
Browse Genome Context