| Start Page |
|
 |
| Start Page |
|
|
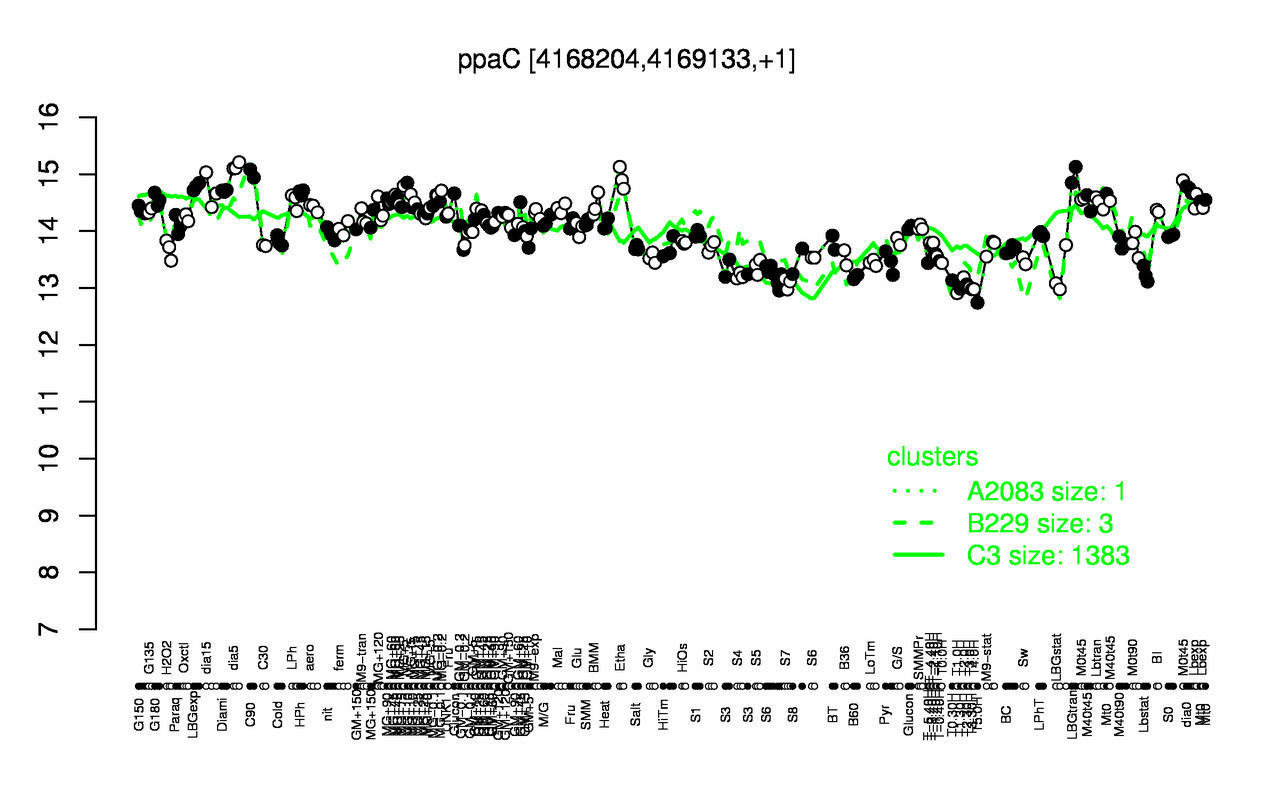
| dia5 | C90 | LBGtran | Etha | LBGexp | dia0 | Diami | dia15 | HPh | M0t45 |
| 15.1 | 15 | 15 | 14.9 | 14.8 | 14.7 | 14.7 | 14.7 | 14.7 | 14.7 |
| T5.0H | T1.0H | T4.0H | T3.30H | T1.30H | T3.0H | T2.30H | S7 | T0.30H | T2.0H |
| 12.7 | 12.9 | 13 | 13 | 13 | 13 | 13.1 | 13.1 | 13.1 | 13.2 |