| Start Page |
|
 |
| Start Page |
|
|
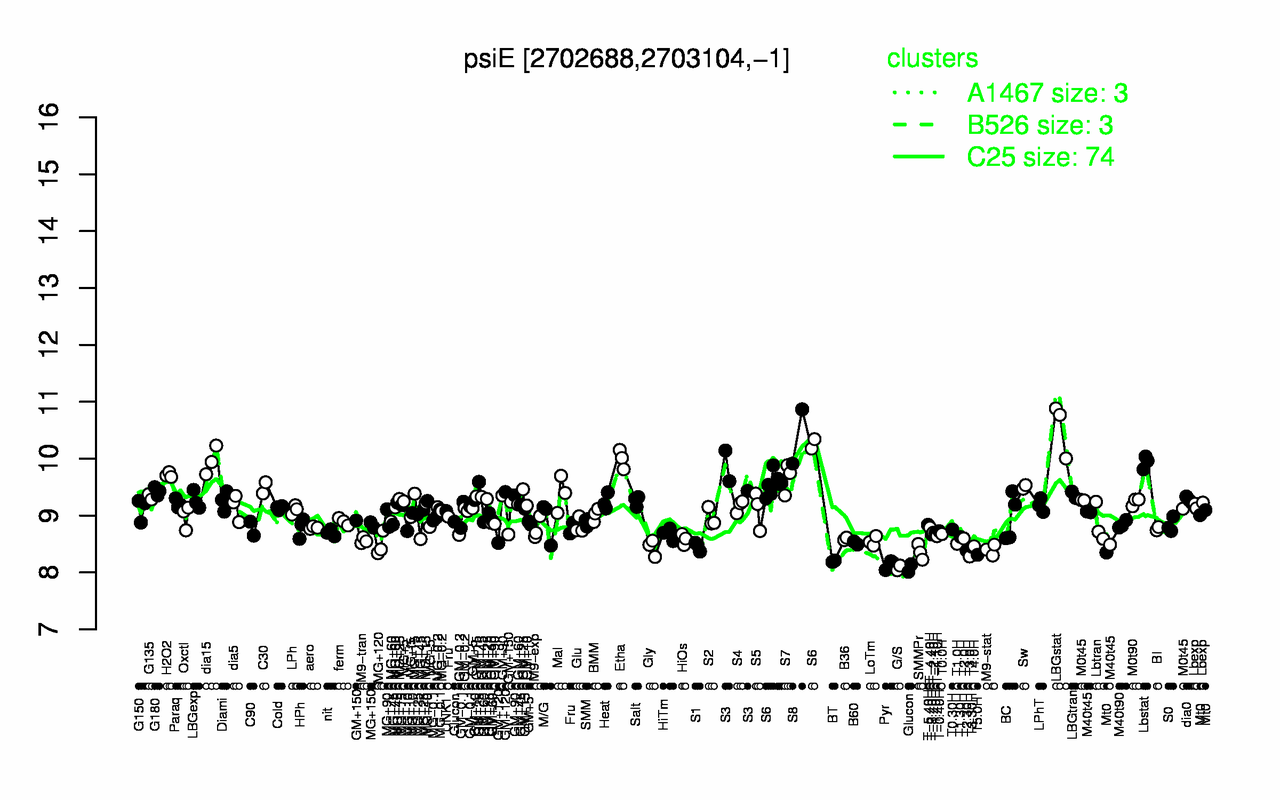
| LBGstat | S8 | Etha | dia15 | Lbstat | S3 | H2O2 | S6 | S7 | Sw |
| 10.6 | 10.4 | 9.99 | 9.97 | 9.94 | 9.73 | 9.71 | 9.71 | 9.66 | 9.5 |
| G/S | Pyr | BT | T3.0H | T5.0H | Glucon | SMMPr | T2.30H | M9-stat | Gly |
| 8.08 | 8.14 | 8.2 | 8.28 | 8.31 | 8.35 | 8.36 | 8.39 | 8.4 | 8.44 |