| Start Page |
|
 |
| Start Page |
|
|
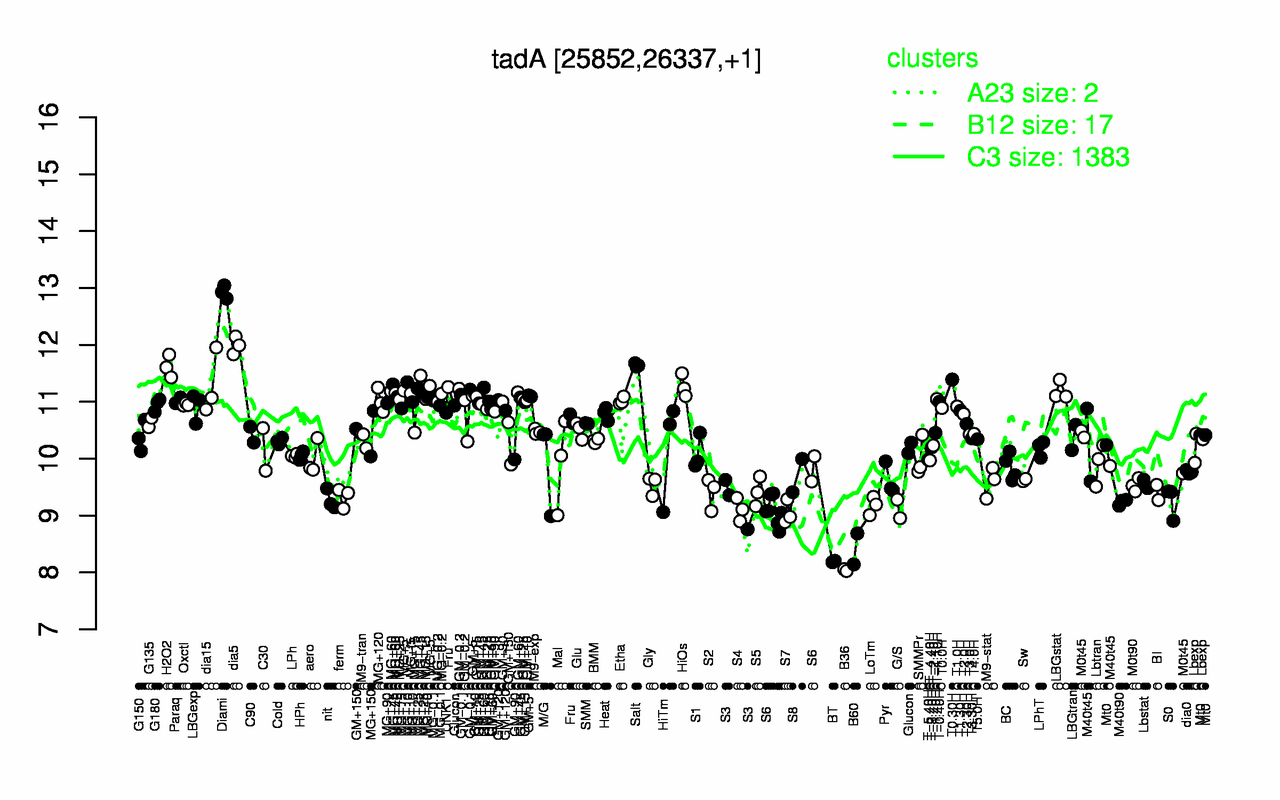
| Diami | dia5 | Salt | H2O2 | T0.30H | dia15 | MG+45 | HiOs | MG+5 | LBGstat |
| 12.9 | 12 | 11.6 | 11.6 | 11.4 | 11.3 | 11.3 | 11.3 | 11.2 | 11.2 |
| B36 | BT | B60 | S7 | S4 | G/S | LoTm | M40t90 | S6 | S3 |
| 8.04 | 8.19 | 8.41 | 9.05 | 9.11 | 9.12 | 9.18 | 9.24 | 9.24 | 9.25 |