B. subtilis Expression Data Browser
Start Page
B. subtilis Expression Data Browser
Gene/Segment:
yneB
Locus Tag:
BSU17870
Details about yneB
Show/Hide
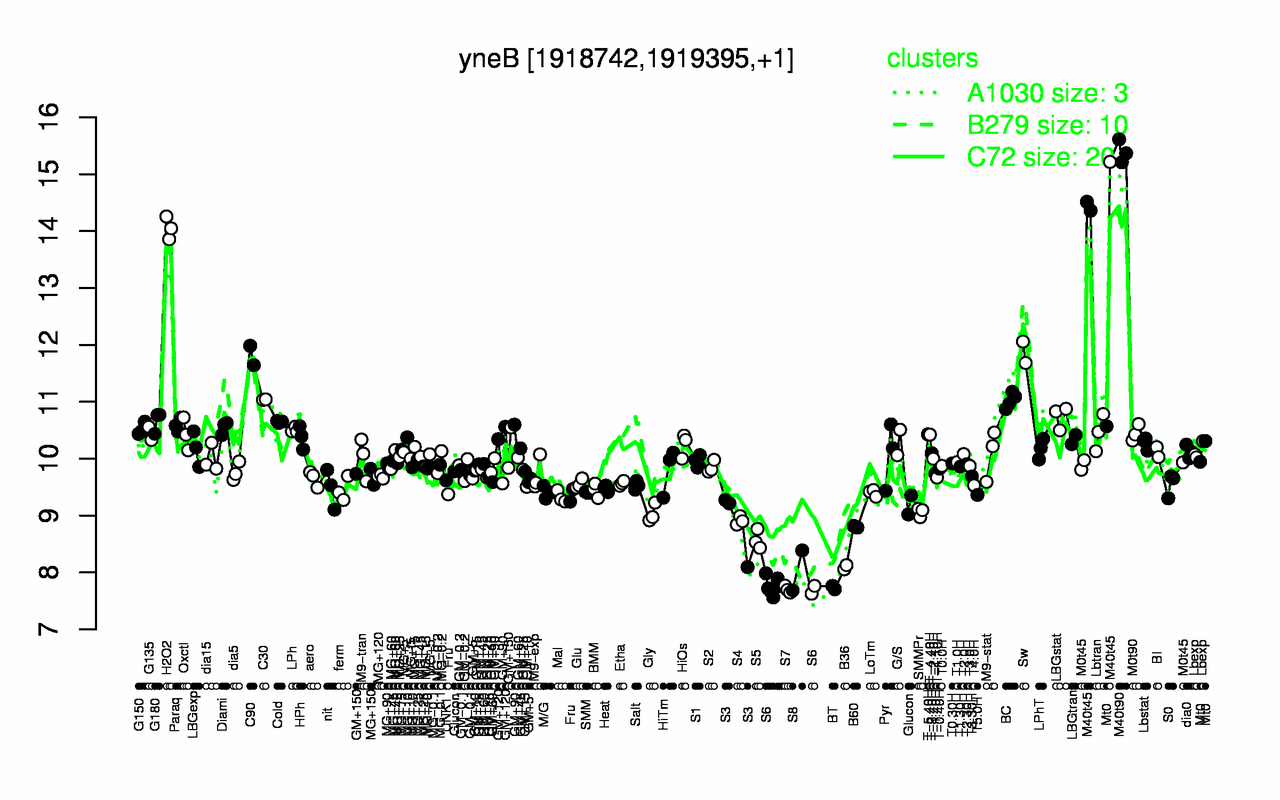
Highest Expression Conditions
M40t90
M40t45
H2O2
Sw
C90
C30
BC
LBGstat
G180
Cold
15.4
14.7
14.1
11.9
11.8
11
11
10.7
10.7
10.6
Lowest Expression Conditions
S7
BT
S6
S8
B36
S5
B60
S3
S4
Gly
7.7
7.73
7.75
8.04
8.09
8.58
8.8
8.86
8.91
9.04
Most Positively Correlated Segments
yneA
lexA
tagC
yorC
polYA
yhaO
yhaZ
recA
S1341
yvzB
0.98
0.83
0.82
0.81
0.79
0.78
0.77
0.76
0.75
0.75
Most Negatively Correlated Segments
coxA
S1055
safA
S1056
S1451
yuiC
S115
kapD
artP
S909
-0.63
-0.62
-0.61
-0.59
-0.58
-0.57
-0.57
-0.57
-0.57
-0.56
Expression Profile of Segment yneB
Show/Hide
Annotation of Gene yneB
Show/Hide
function
16.13: Shape
inference
ab initio prediction:AMIGene:2.0
codon_start
1
product
putative cell division protein
transl_table
11
note
Evidence 3: Function proposed based on presence of conserved amino acid motif, structural feature or limited homology; PubMedId: 12581363, 16267290, 17020588; Product type cp: cell process
db_xref
GI:2634171
protein_id
CAB13671.1
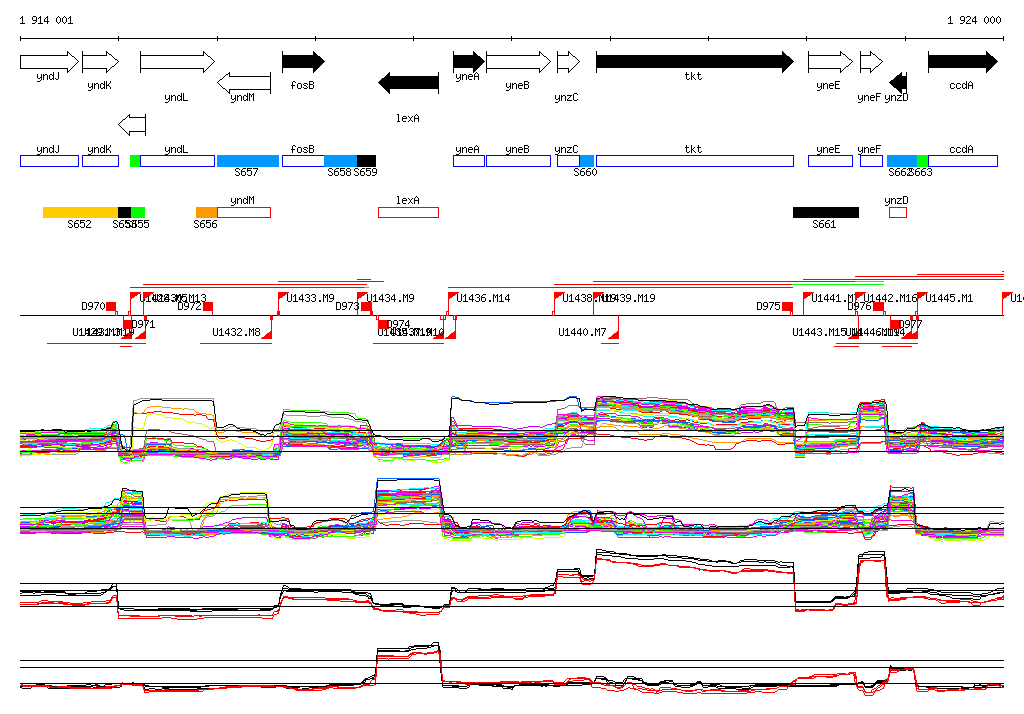
Genomic View of Gene/Segment yneB
Show/Hide
(Legend)
Browse Genome Context