B. subtilis Expression Data Browser
Details about S1106 Show/Hide
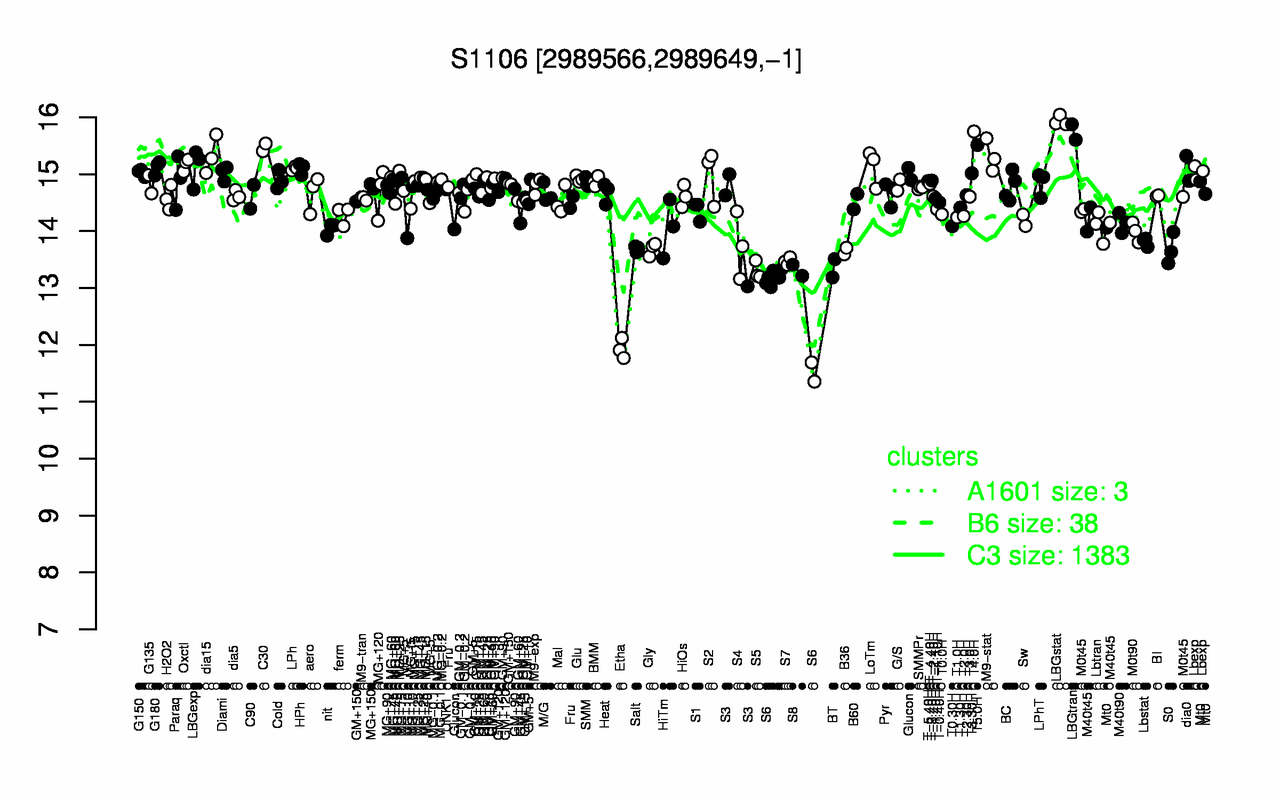
Highest Expression Conditions
LBGstat T4.0H LBGtran T5.0H C30 dia15 M9-stat Oxctl LBGexp LoTm
15.9 15.8 15.7 15.5 15.5 15.3 15.3 15.2 15.1 15.1
Lowest Expression Conditions
Etha S6 S5 S8 BT S7 B36 S0 Salt Gly
11.9 12.8 13.3 13.3 13.3 13.5 13.6 13.7 13.7 13.7
Most Positively Correlated Segments
accD accA S589 NA S1167 S10 cdsA S50 rplM trmB
0.93 0.84 0.76 0.75 0.75 0.74 0.73 0.73 0.72 0.72
Most Negatively Correlated Segments
S318 yetO S147 yojJ S275 ymzB S273 S139 yhjQ yhcM
-0.72 -0.71 -0.71 -0.7 -0.68 -0.68 -0.68 -0.67 -0.66 -0.66
Expression Profile of Segment S1106 Show/Hide
Genomic View of Gene/Segment S1106 Show/Hide
(Legend)