| Start Page |
|
 |
| Start Page |
|
|
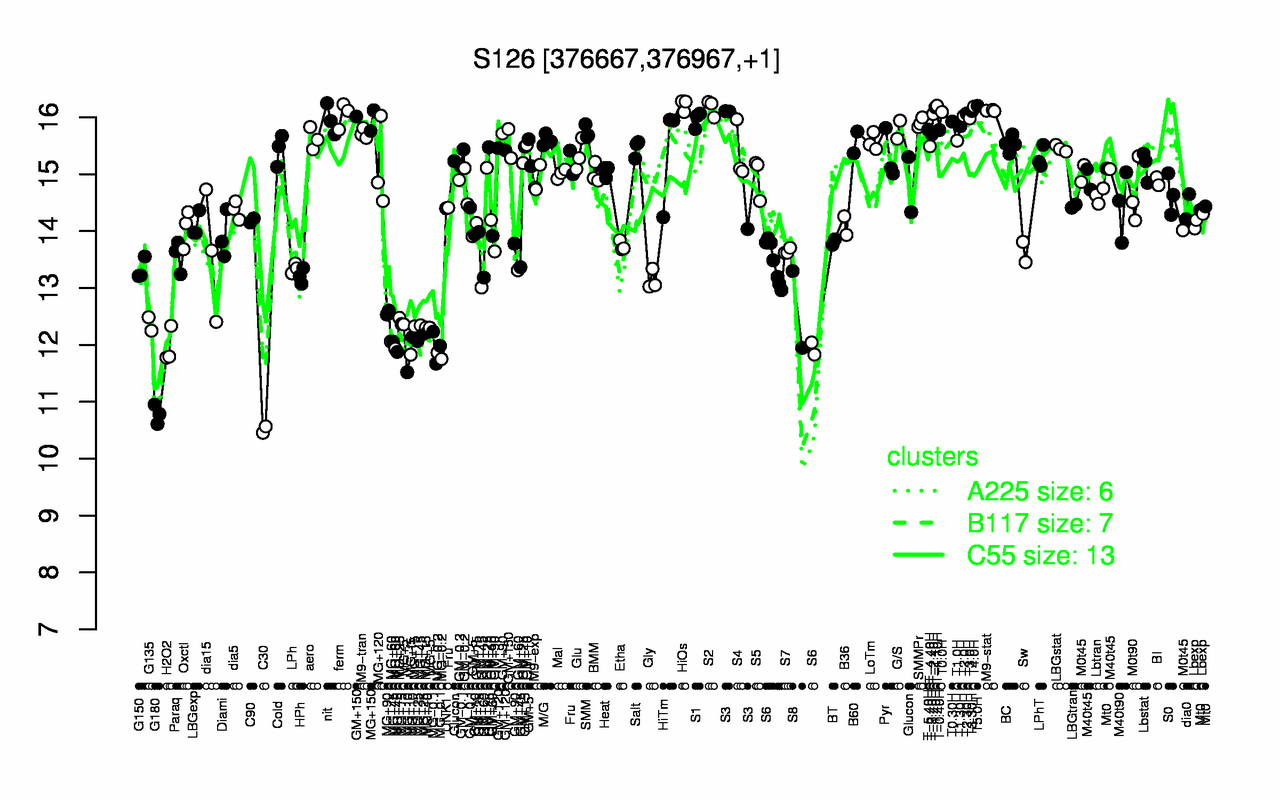
| HiOs | T-1.10H | T5.0H | T4.0H | T-1.40H | S2 | M9-stat | T3.30H | T0.0H | T2.30H |
| 16.2 | 16.2 | 16.2 | 16.2 | 16.2 | 16.2 | 16.1 | 16.1 | 16.1 | 16.1 |
| C30 | G180 | MG-0.2 | MG+t5 | MG+10 | MG-0.1 | H2O2 | MG+60 | MG+45 | MG+25 |
| 10.5 | 10.8 | 11.8 | 11.8 | 12 | 12 | 12 | 12 | 12.1 | 12.2 |