B. subtilis Expression Data Browser
Start Page
B. subtilis Expression Data Browser
Gene/Segment:
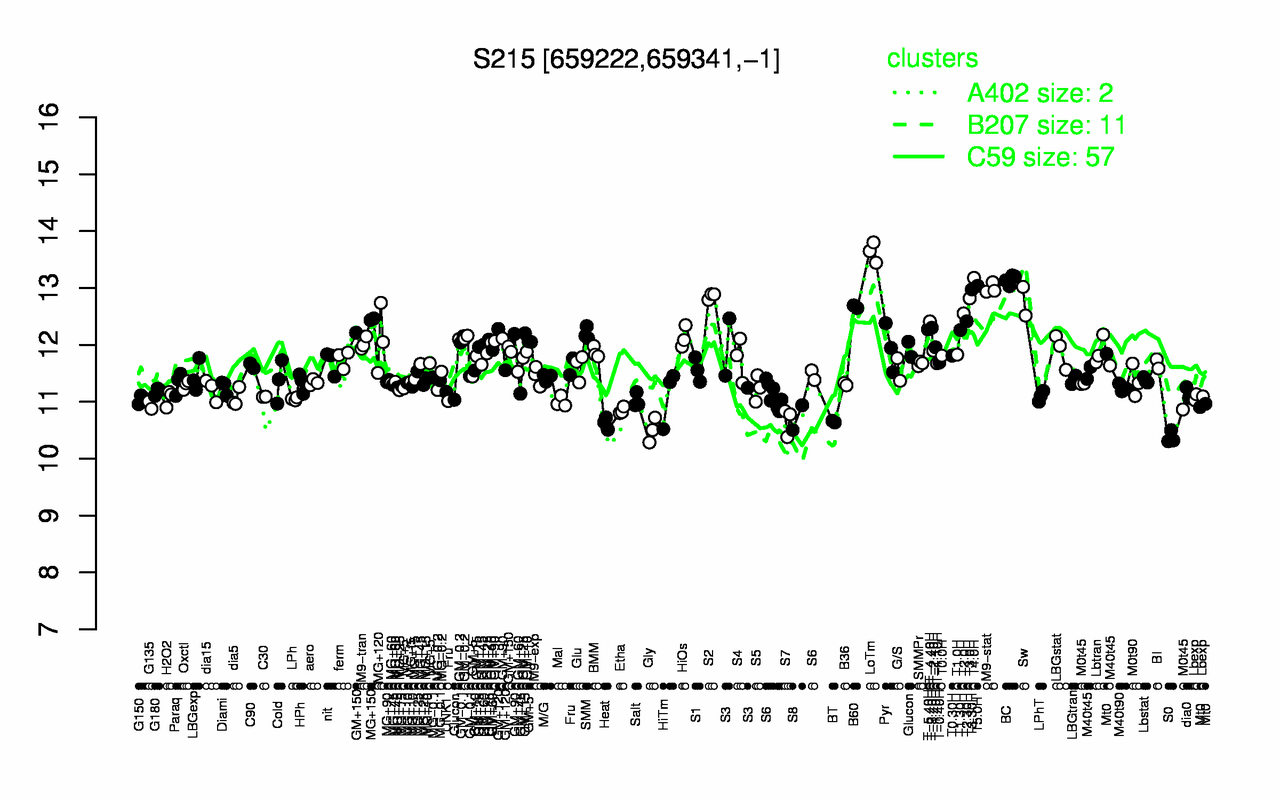
S215
Locus Tag:
new_659222_659341_c
Details about S215
Show/Hide
Highest Expression Conditions
LoTm
T4.0H
BC
T5.0H
M9-stat
T3.30H
S2
T3.0H
Sw
B60
13.6
13.2
13.1
13
13
13
12.9
12.8
12.8
12.7
Lowest Expression Conditions
S0
Gly
Heat
BT
S7
S8
Etha
G135
Mal
Salt
10.4
10.5
10.6
10.7
10.7
10.7
10.8
10.9
11
11
Most Positively Correlated Segments
ydzW
ydzW
ydzW
ydzW
ydzW
ydzW
ydzW
S182
S278
yhjM
0.92
0.75
0.74
0.74
0.74
0.72
0.71
0.7
0.69
0.66
Most Negatively Correlated Segments
tcyB
cysS
ytwI
hemN
tcyC
thiN
tcyA
S127
yheB
yisB
-0.61
-0.6
-0.6
-0.6
-0.59
-0.59
-0.59
-0.57
-0.56
-0.55
Expression Profile of Segment S215
Show/Hide
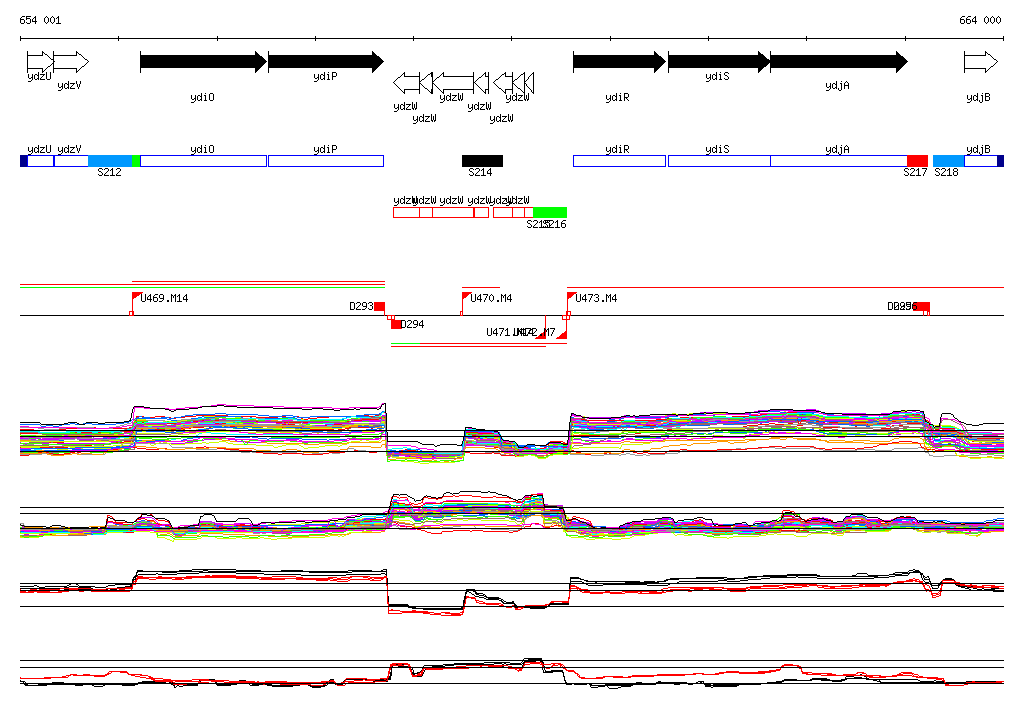
Genomic View of Gene/Segment S215
Show/Hide
(Legend)
Browse Genome Context