| Start Page |
|
 |
| Start Page |
|
|
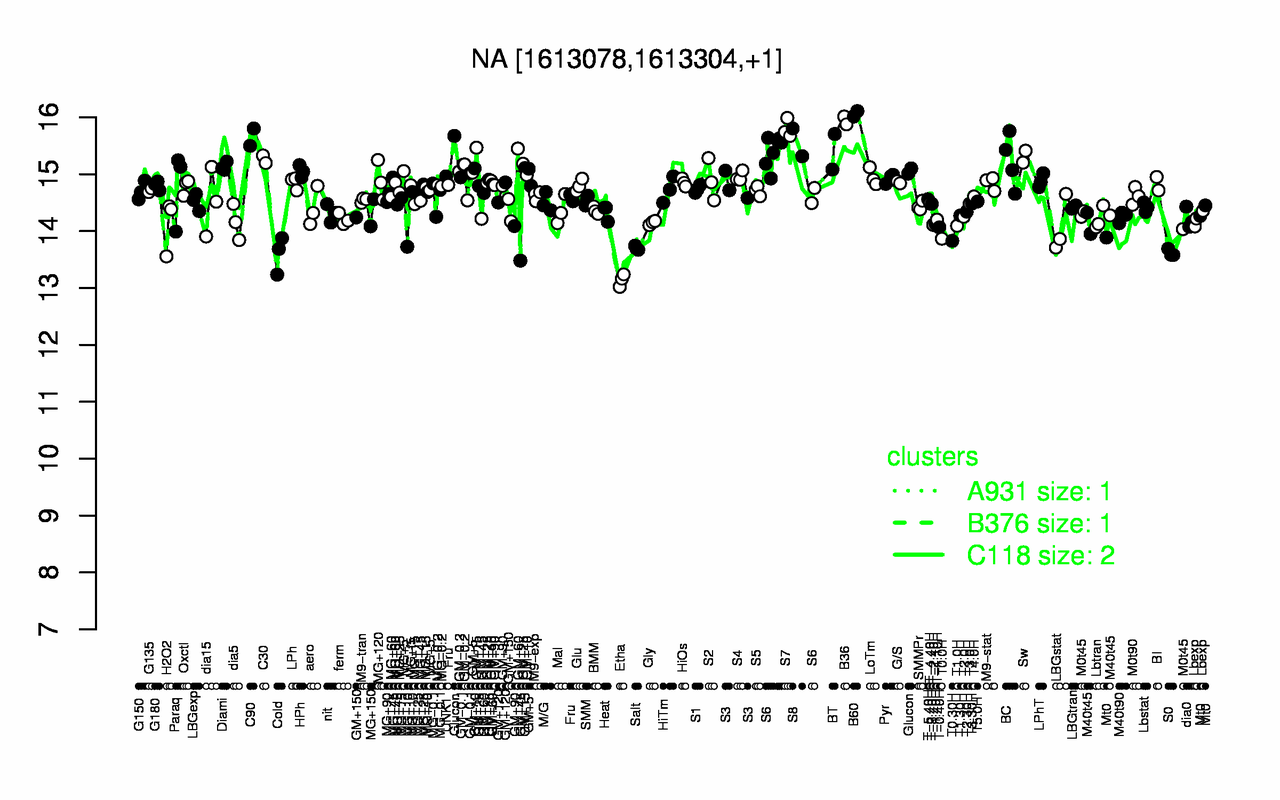
| B60 | B36 | S7 | C90 | S8 | BT | Sw | C30 | Glucon | S6 |
| 16.1 | 15.9 | 15.8 | 15.7 | 15.6 | 15.4 | 15.3 | 15.3 | 15.3 | 15.2 |
| Etha | Cold | S0 | Salt | T0.30H | T0.0H | T-0.40H | LBGstat | T1.0H | T-2.40H |
| 13.1 | 13.6 | 13.6 | 13.7 | 13.8 | 13.9 | 14.1 | 14.1 | 14.1 | 14.1 |