| Start Page |
|
 |
| Start Page |
|
|
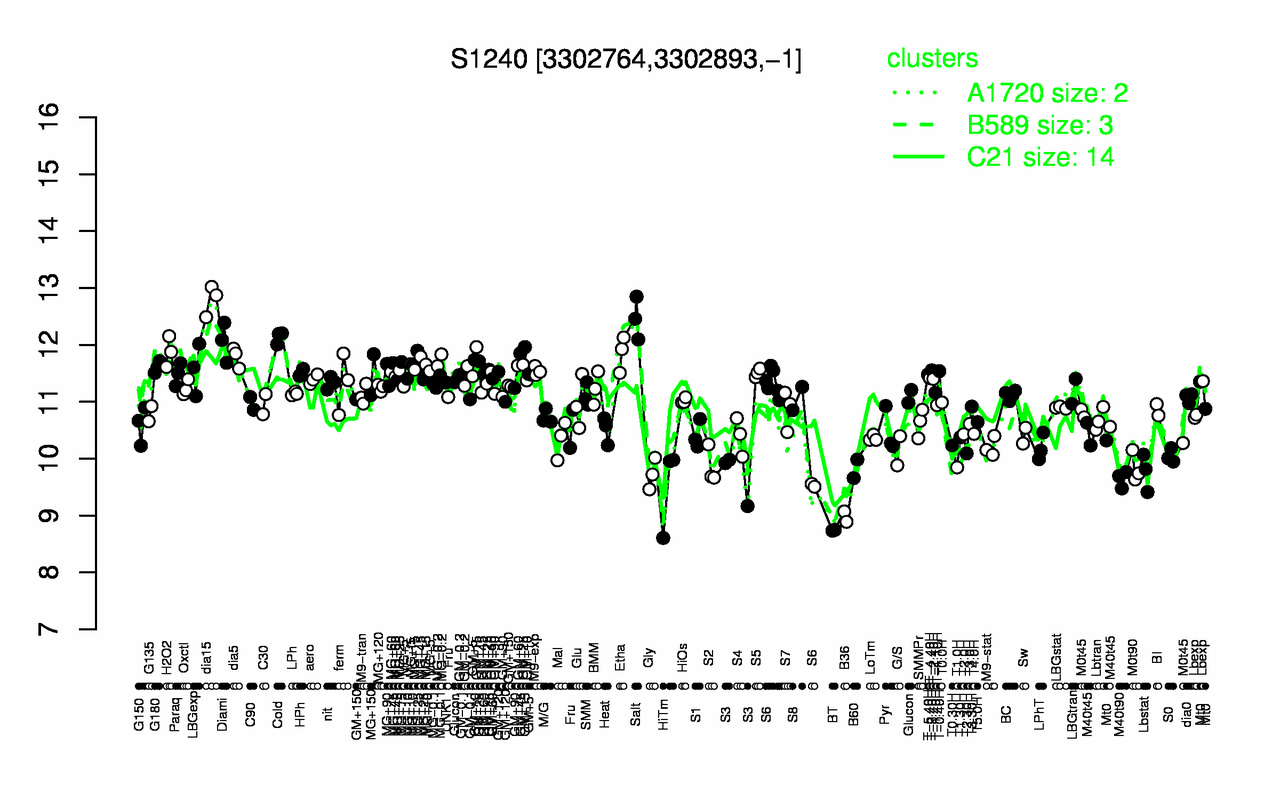
| dia15 | Salt | Cold | Diami | H2O2 | Etha | GM+15 | dia5 | MG-0.2 | MG+t5 |
| 12.8 | 12.5 | 12.1 | 12.1 | 11.9 | 11.9 | 11.8 | 11.8 | 11.7 | 11.7 |
| BT | B36 | HiTm | M40t90 | S3 | Gly | Lbstat | B60 | M0t90 | T1.0H |
| 8.74 | 8.98 | 9.51 | 9.65 | 9.69 | 9.73 | 9.77 | 9.82 | 9.84 | 9.85 |