| Start Page |
|
 |
| Start Page |
|
|
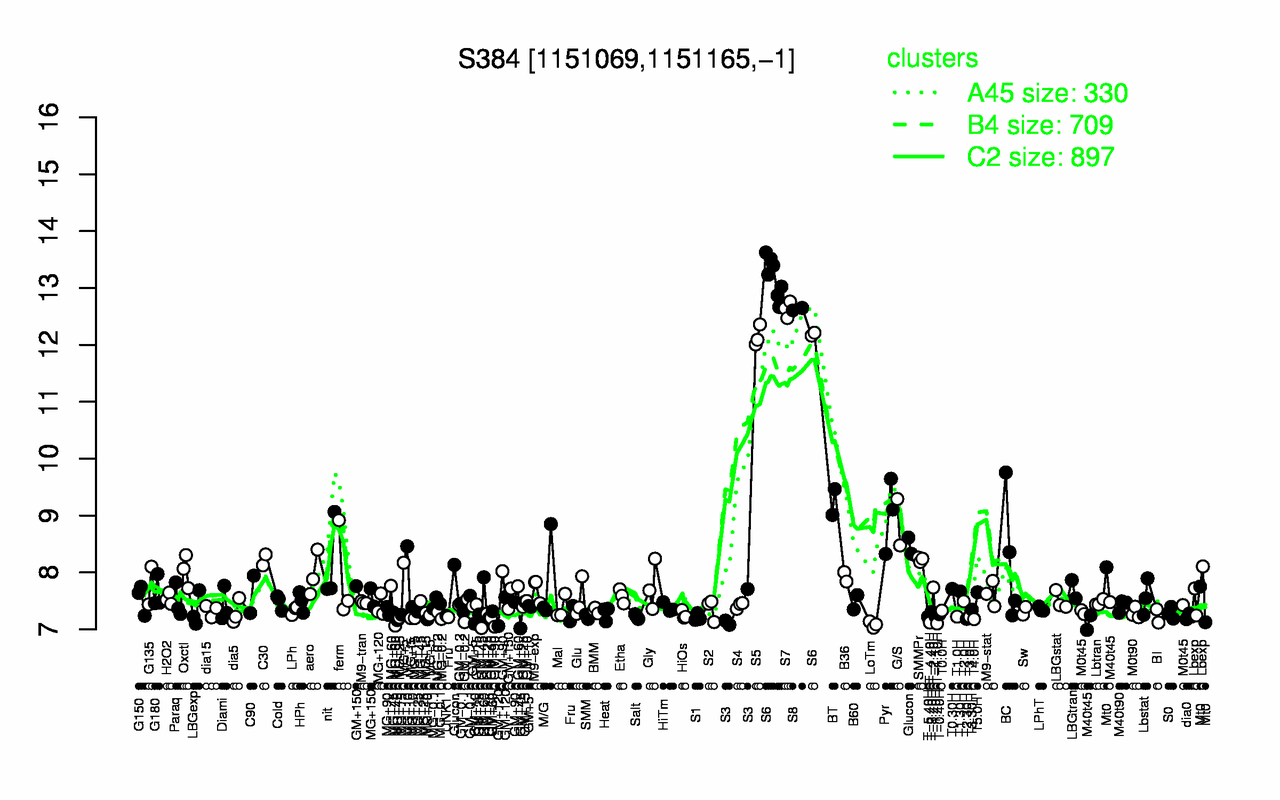
| S6 | S8 | S7 | S5 | BT | Pyr | G/S | Glucon | SMMPr | C30 |
| 13 | 12.6 | 12.6 | 12.2 | 9.24 | 9.03 | 8.88 | 8.36 | 8.23 | 8.22 |
| GM+45 | LoTm | T-1.10H | T-4.40H | T4.0H | T2.30H | MG+t5 | S1 | T-5.40H | T3.0H |
| 7.08 | 7.08 | 7.1 | 7.12 | 7.18 | 7.18 | 7.2 | 7.21 | 7.22 | 7.22 |