| Start Page |
|
 |
| Start Page |
|
|
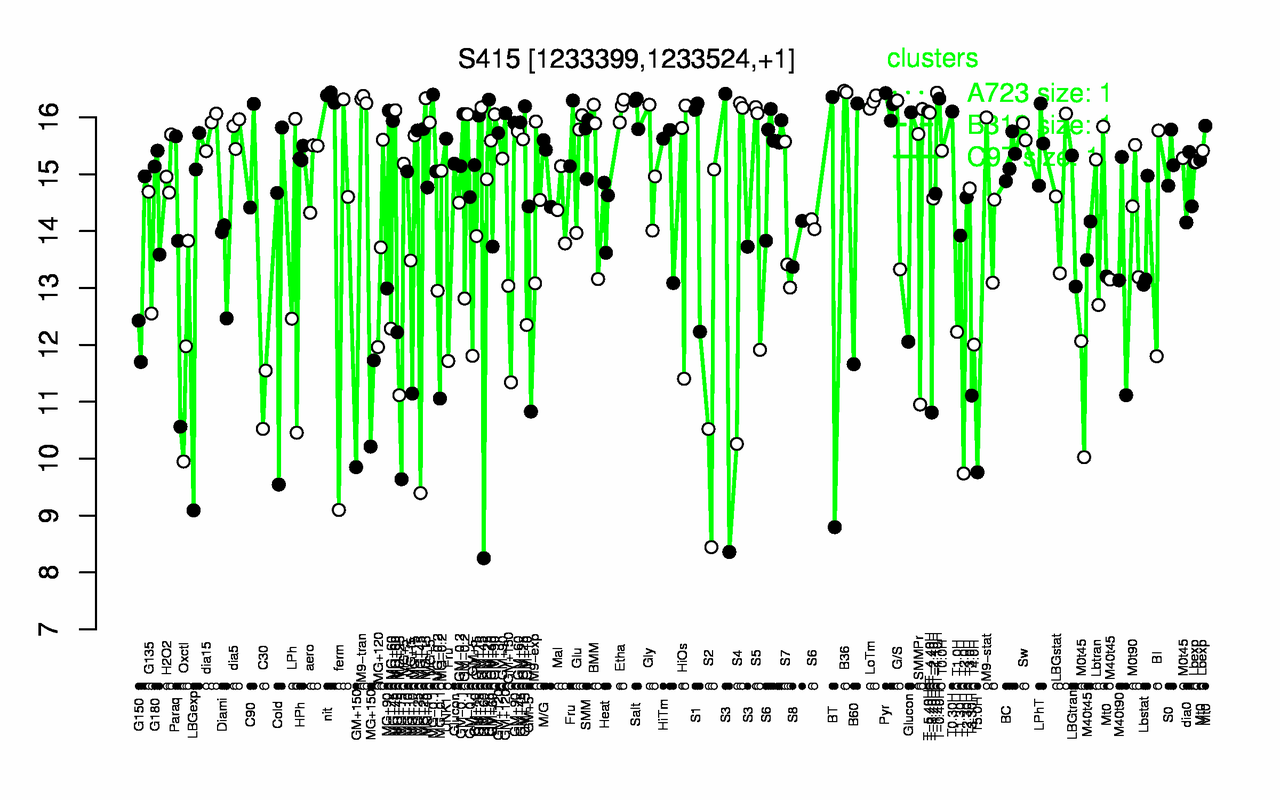
| B36 | T-1.10H | nit | T-0.40H | M9-tran | LoTm | Pyr | Etha | Salt | T0.30H |
| 16.5 | 16.4 | 16.4 | 16.3 | 16.3 | 16.3 | 16.2 | 16.1 | 16.1 | 16.1 |
| T2.0H | T5.0H | T-3.40H | MG+150 | C30 | T3.30H | S2 | GM+150 | Oxctl | T4.0H |
| 9.74 | 9.76 | 10.8 | 11 | 11 | 11.1 | 11.3 | 11.4 | 11.9 | 12 |