| Start Page |
|
 |
| Start Page |
|
|
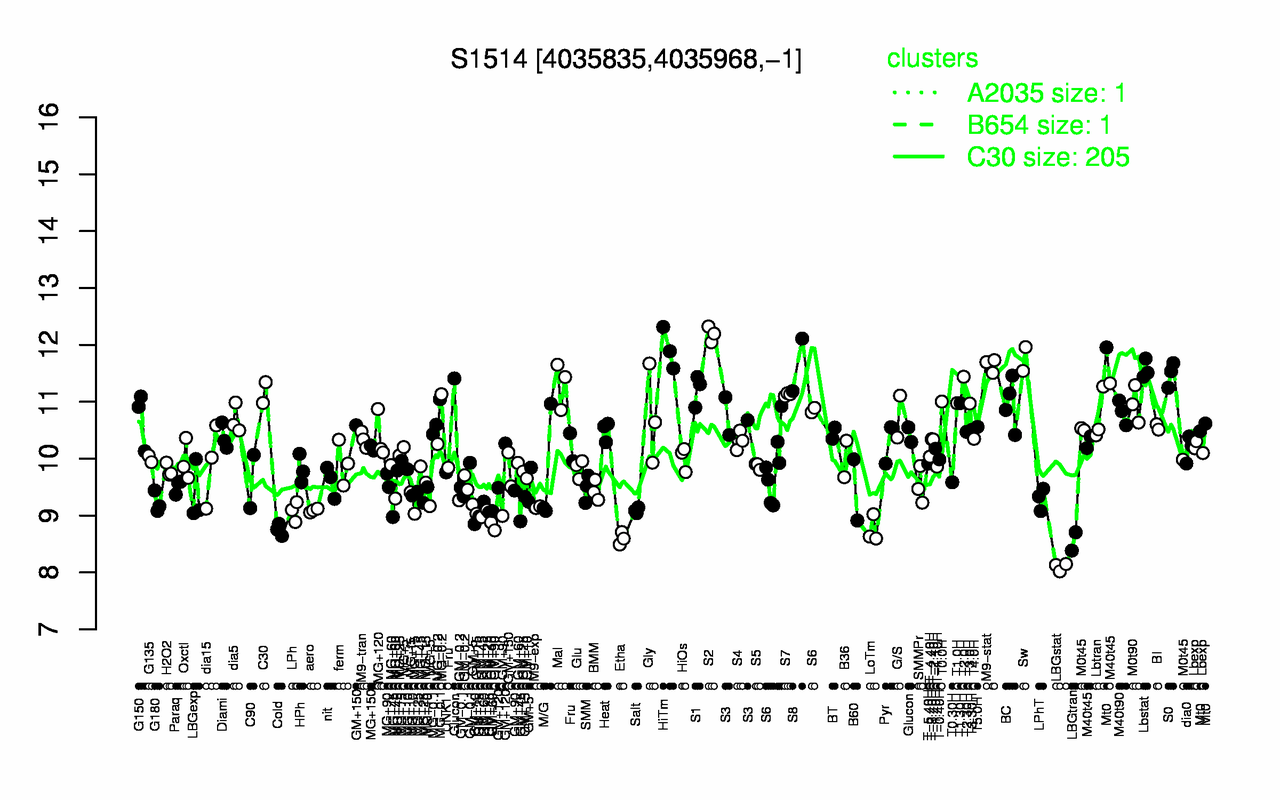
| S2 | HiTm | Sw | S8 | M9-stat | Lbstat | S0 | T2.0H | Mal | S1 |
| 12.2 | 11.9 | 11.8 | 11.6 | 11.6 | 11.6 | 11.5 | 11.4 | 11.3 | 11.2 |
| LBGstat | LBGtran | Etha | LoTm | Cold | GM+45 | GM+90 | LPh | aero | Salt |
| 8.1 | 8.54 | 8.6 | 8.75 | 8.75 | 8.92 | 9.06 | 9.07 | 9.09 | 9.09 |