B. subtilis Expression Data Browser
Start Page
B. subtilis Expression Data Browser
Gene/Segment:
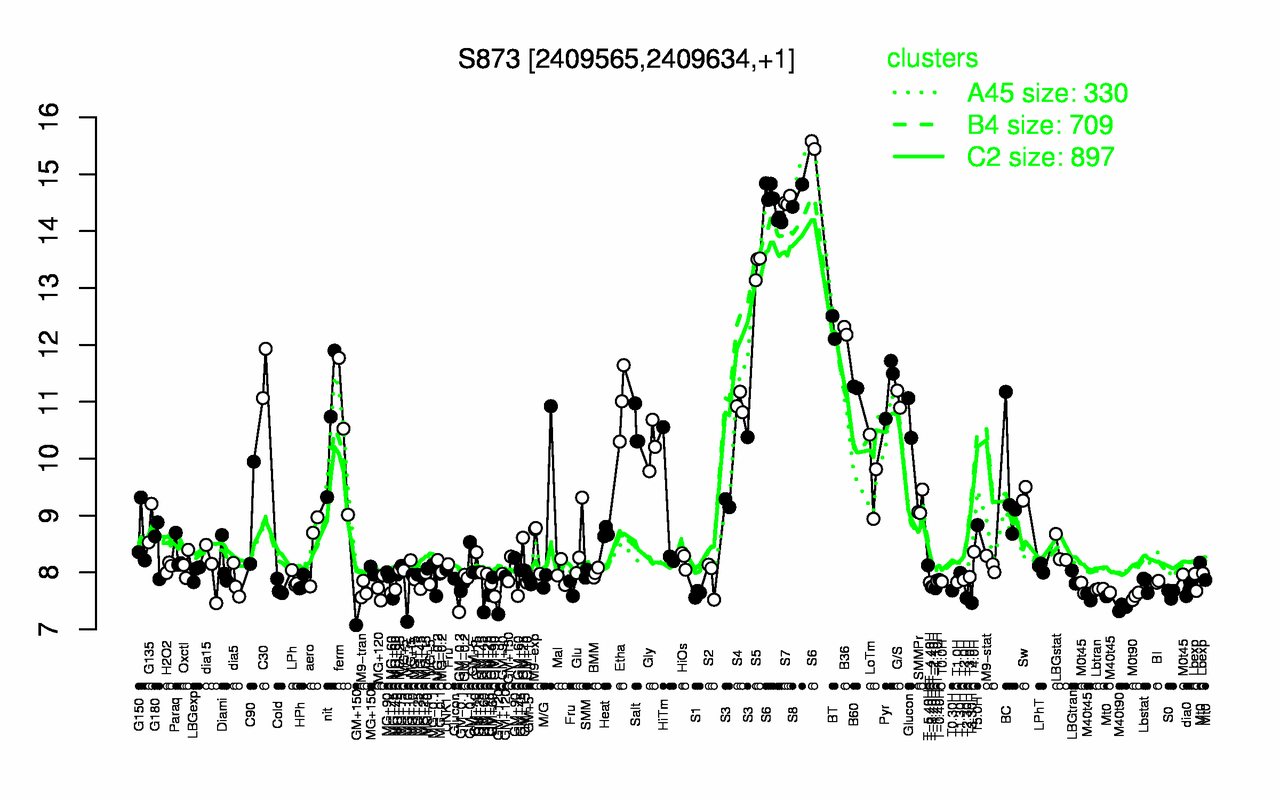
S873
Locus Tag:
new_2409565_2409634
Details about S873
Show/Hide
Highest Expression Conditions
S6
S8
S7
S5
BT
B36
C30
Pyr
B60
G/S
14.7
14.6
14.5
13.4
12.3
12.2
11.5
11.3
11.3
11
Lowest Expression Conditions
M40t90
T3.30H
T2.30H
M0t90
M40t45
GM+120
GM+60
S1
S0
MG+60
7.38
7.46
7.55
7.58
7.59
7.6
7.6
7.63
7.63
7.67
Most Positively Correlated Segments
S1562
ysnD
S1397
S885
cotM
S872
yppG
ydgB
gerPF
S195
0.93
0.93
0.92
0.92
0.92
0.92
0.92
0.91
0.91
0.91
Most Negatively Correlated Segments
parA
yvcP
pbpD
ptkA
yvcQ
parB
cheR
yusH
yugG
nosA
-0.85
-0.84
-0.82
-0.82
-0.82
-0.82
-0.82
-0.82
-0.82
-0.82
Expression Profile of Segment S873
Show/Hide
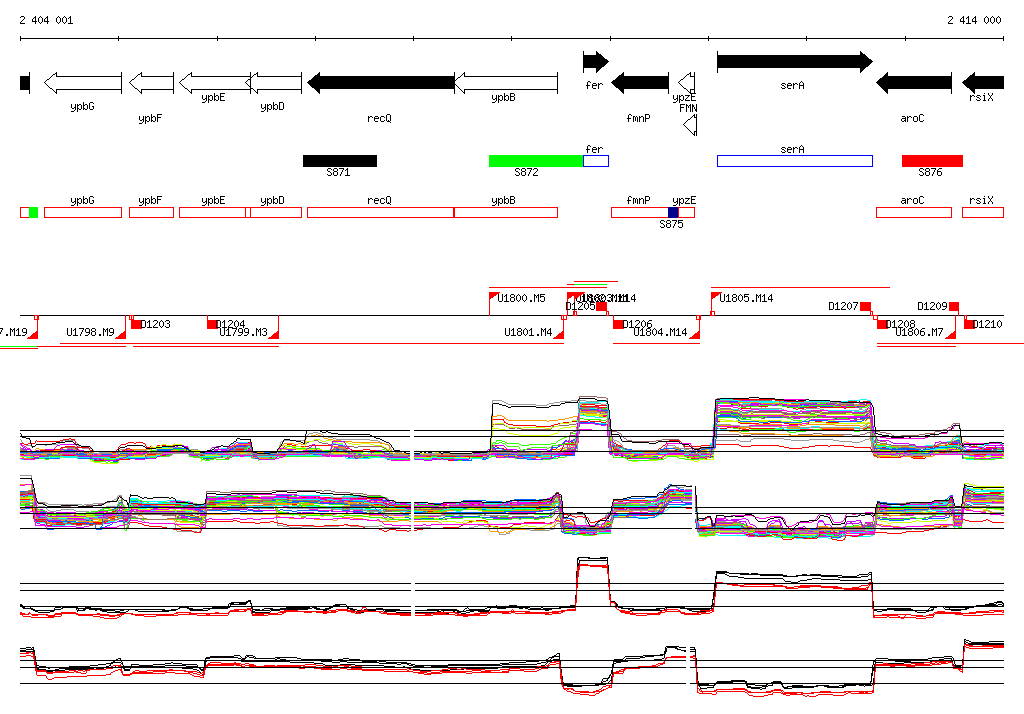
Genomic View of Gene/Segment S873
Show/Hide
(Legend)
Browse Genome Context