B. subtilis Expression Data Browser
Start Page
B. subtilis Expression Data Browser
Gene/Segment:
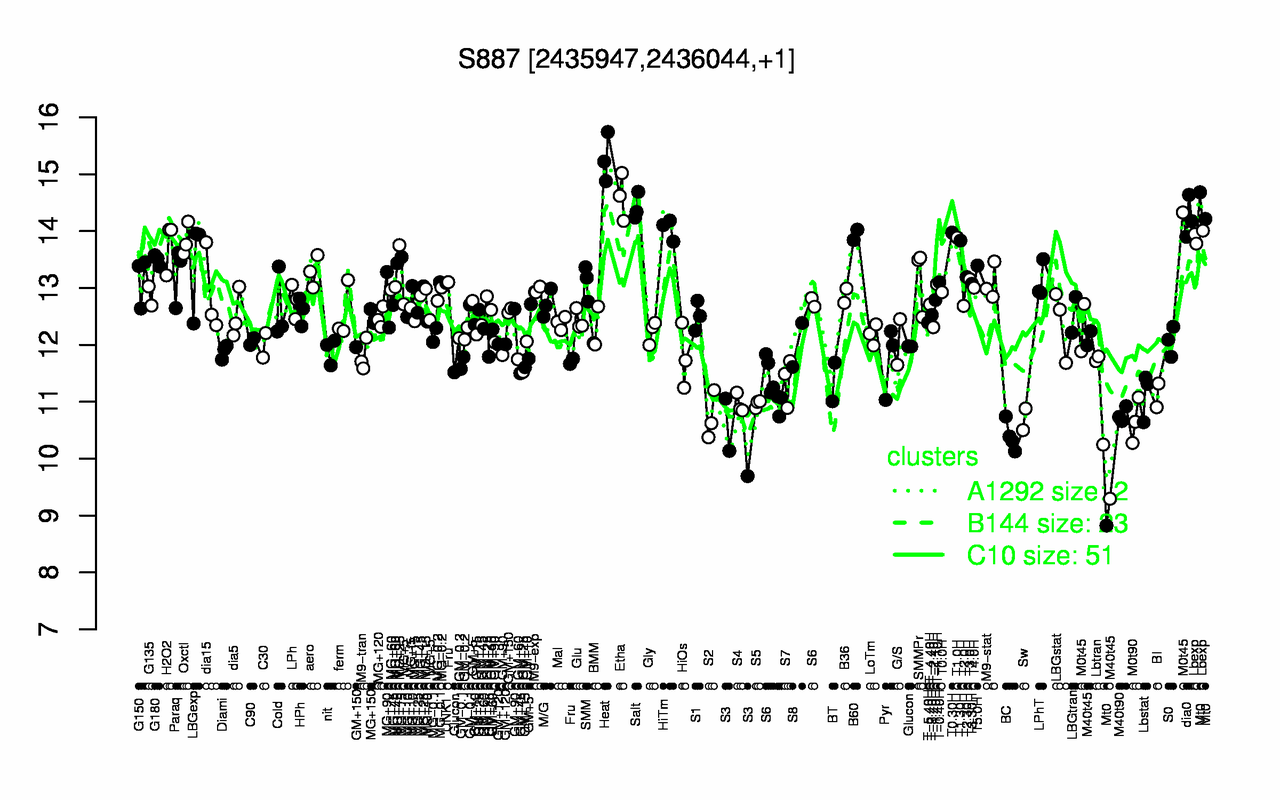
S887
Locus Tag:
new_2435947_2436044
Details about S887
Show/Hide
Highest Expression Conditions
Heat
Etha
Salt
dia0
HiTm
T0.30H
B60
Lbexp
T1.0H
Oxctl
15.3
14.6
14.4
14.2
14
14
13.9
13.9
13.9
13.8
Lowest Expression Conditions
S3
BC
M0t90
Sw
S2
M40t90
S4
S5
BI
Lbstat
10.3
10.4
10.7
10.7
10.7
10.8
11
11
11.1
11.1
Most Positively Correlated Segments
ypuA
S843
ydaH
S1380
S1469
maf
yrhH
S1023
rodA
sigM
0.91
0.78
0.77
0.77
0.76
0.74
0.73
0.73
0.72
0.71
Most Negatively Correlated Segments
ctaG
ctaF
ctaE
ctaC
ctaD
yraI
cccA
S544
yraJ
acpK
-0.6
-0.59
-0.59
-0.59
-0.58
-0.56
-0.56
-0.56
-0.56
-0.55
Expression Profile of Segment S887
Show/Hide
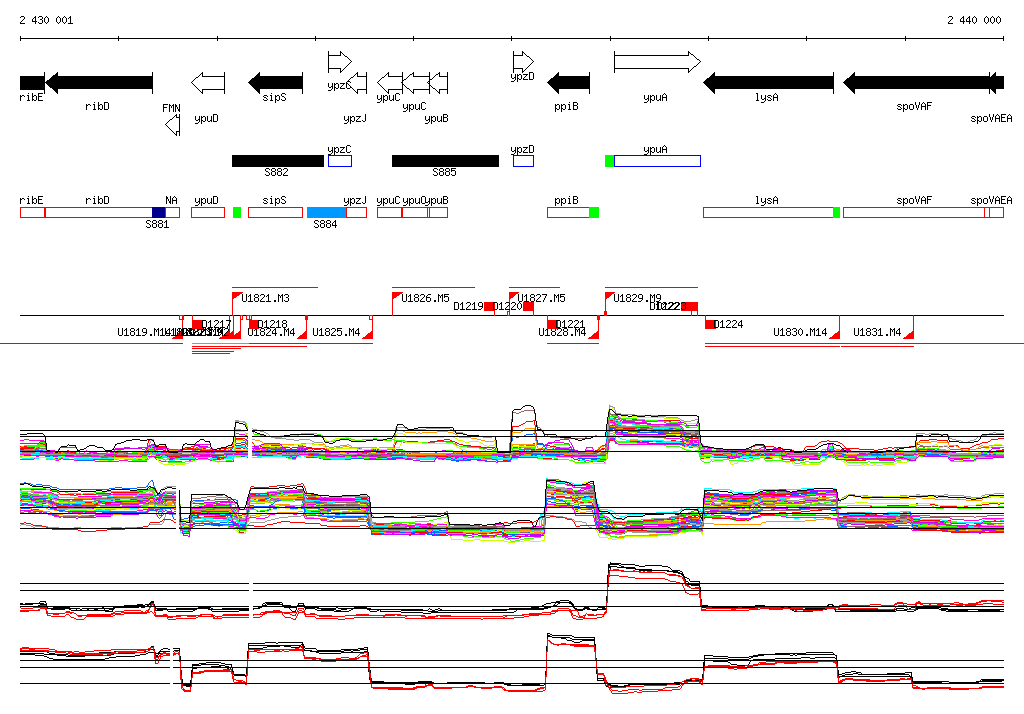
Genomic View of Gene/Segment S887
Show/Hide
(Legend)
Browse Genome Context