B. subtilis Expression Data Browser
Start Page
B. subtilis Expression Data Browser
Gene/Segment:
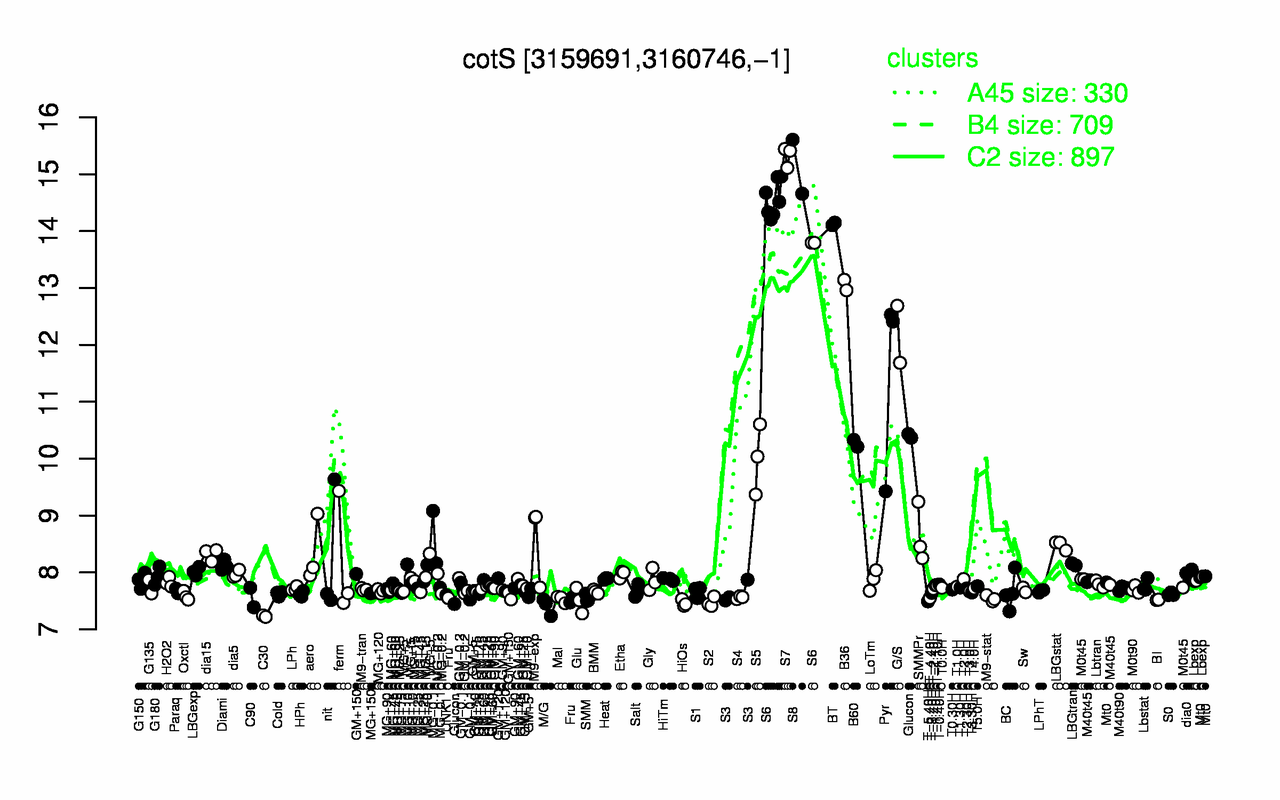
cotS
Locus Tag:
BSU30900
Details about cotS
Show/Hide
Highest Expression Conditions
S7
S8
S6
BT
B36
G/S
Pyr
B60
S5
Glucon
15.3
15.1
14.4
14.1
13.1
12.2
11.5
10.3
10
9.42
Lowest Expression Conditions
C30
M/G
HiOs
S2
T-5.40H
Glu
BI
Mal
Fru
M9-stat
7.23
7.4
7.46
7.48
7.49
7.51
7.52
7.53
7.53
7.54
Most Positively Correlated Segments
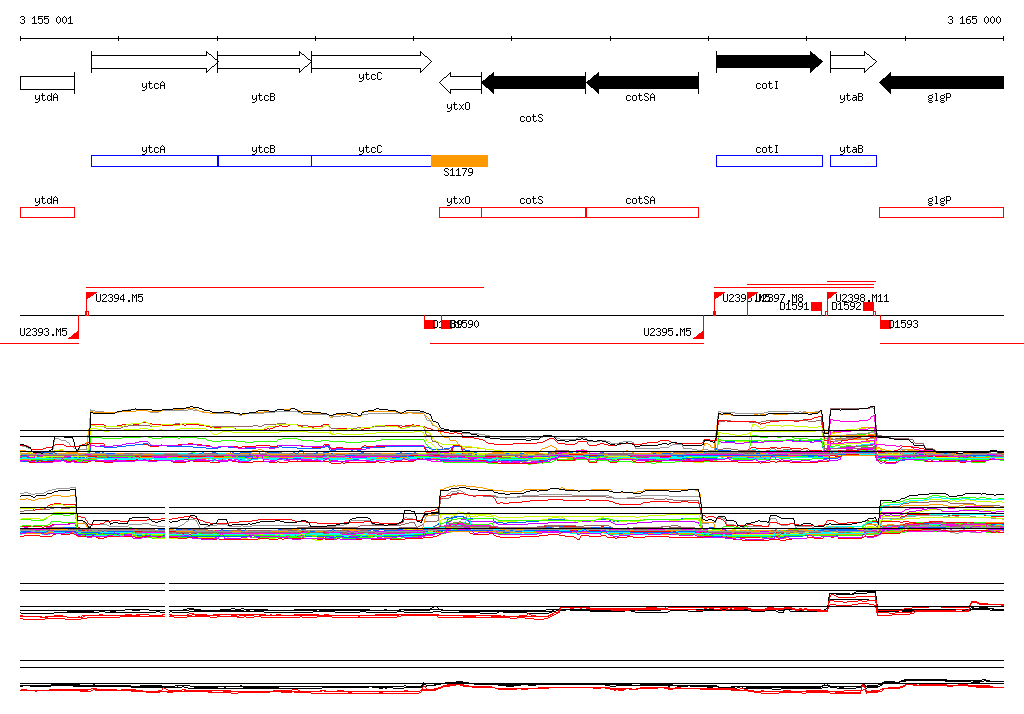
cotSA
ytxO
ytcB
ytcC
ytcA
yodH
spsC
spsF
spsE
spsB
1
0.99
0.97
0.97
0.96
0.96
0.96
0.96
0.96
0.96
Most Negatively Correlated Segments
ykuH
S511
bceR
ptkA
S1355
parA
S1189
bceS
yeaC
pbpD
-0.79
-0.79
-0.78
-0.78
-0.77
-0.77
-0.77
-0.76
-0.76
-0.75
Expression Profile of Segment cotS
Show/Hide
Annotation of Gene cotS
Show/Hide
function
16.5: Explore
function
16.13: Shape
inference
ab initio prediction:AMIGene:2.0
codon_start
1
product
spore coat protein
transl_table
11
note
Evidence 1a: Function experimentally demonstrated in the studied strain; PubMedId: 10234840, 11737650, 7545510, 9603889; Product type cp: cell process
db_xref
GI:2635574
protein_id
CAB15068.1
Genomic View of Gene/Segment cotS
Show/Hide
(Legend)
Browse Genome Context