B. subtilis Expression Data Browser
Start Page
B. subtilis Expression Data Browser
Gene/Segment:
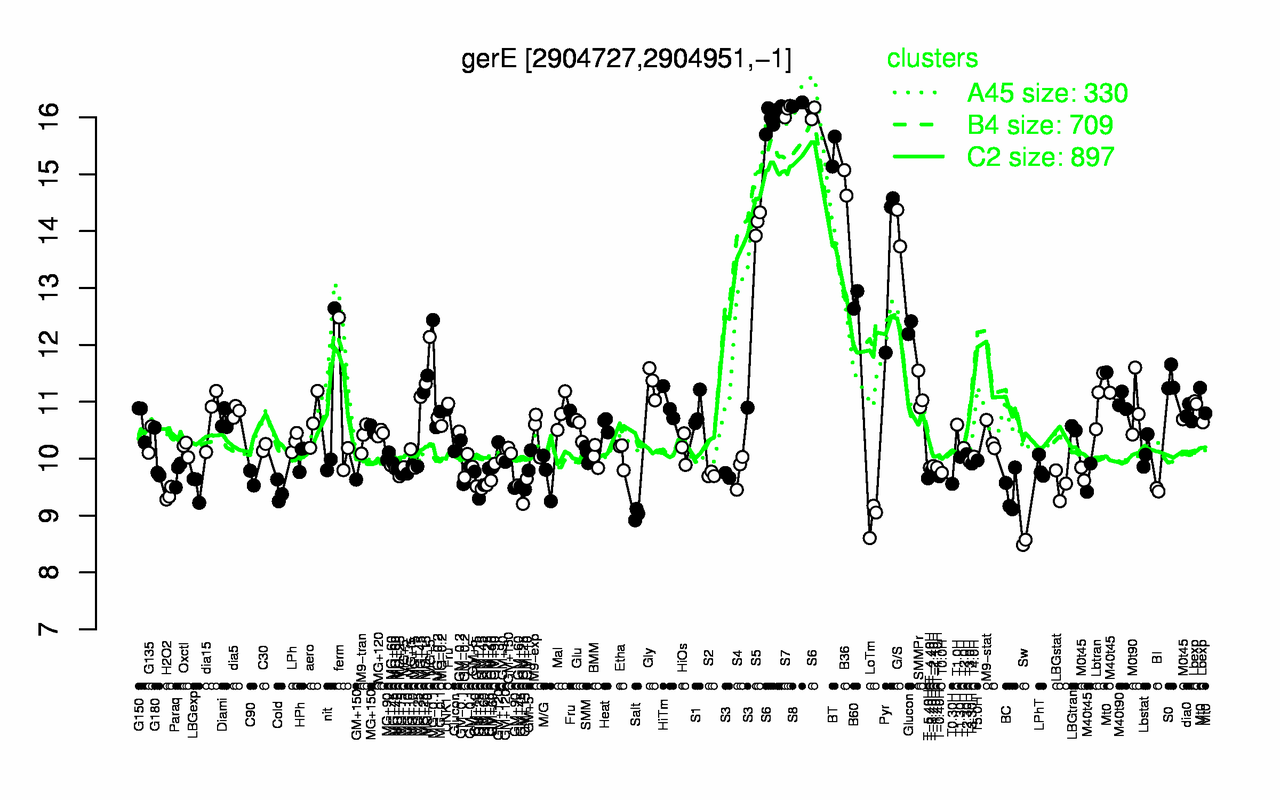
gerE
Locus Tag:
BSU28410
Details about gerE
Show/Hide
Highest Expression Conditions
S8
S7
S6
BT
B36
S5
G/S
Pyr
B60
Glucon
16.2
16.1
16
15.4
14.8
14.1
14.1
13.6
12.8
11.6
Lowest Expression Conditions
Sw
LoTm
Salt
GM+25
H2O2
Cold
BC
BI
LBGexp
GM+45
8.53
8.94
9.02
9.35
9.37
9.42
9.42
9.45
9.5
9.53
Most Positively Correlated Segments
cotSA
cotS
spsA
spsB
ytcB
ytcA
ytcC
spsF
spsC
spsE
0.93
0.93
0.92
0.92
0.92
0.92
0.92
0.92
0.92
0.92
Most Negatively Correlated Segments
bceR
ccpB
S1189
ykuH
yeaC
ywqC
ptkA
rnhC
S511
bceS
-0.77
-0.77
-0.77
-0.76
-0.76
-0.76
-0.76
-0.75
-0.75
-0.75
Expression Profile of Segment gerE
Show/Hide
Annotation of Gene gerE
Show/Hide
function
16.3: Control
inference
ab initio prediction:AMIGene:2.0
codon_start
1
product
transcriptional regulator
transl_table
11
note
Evidence 1a: Function experimentally demonstrated in the studied strain; PubMedId: 11243786, 11418558, 11741866, 14702409, 17172339; Product type cp: cell process
db_xref
GI:225185283
protein_id
CAB14801.2
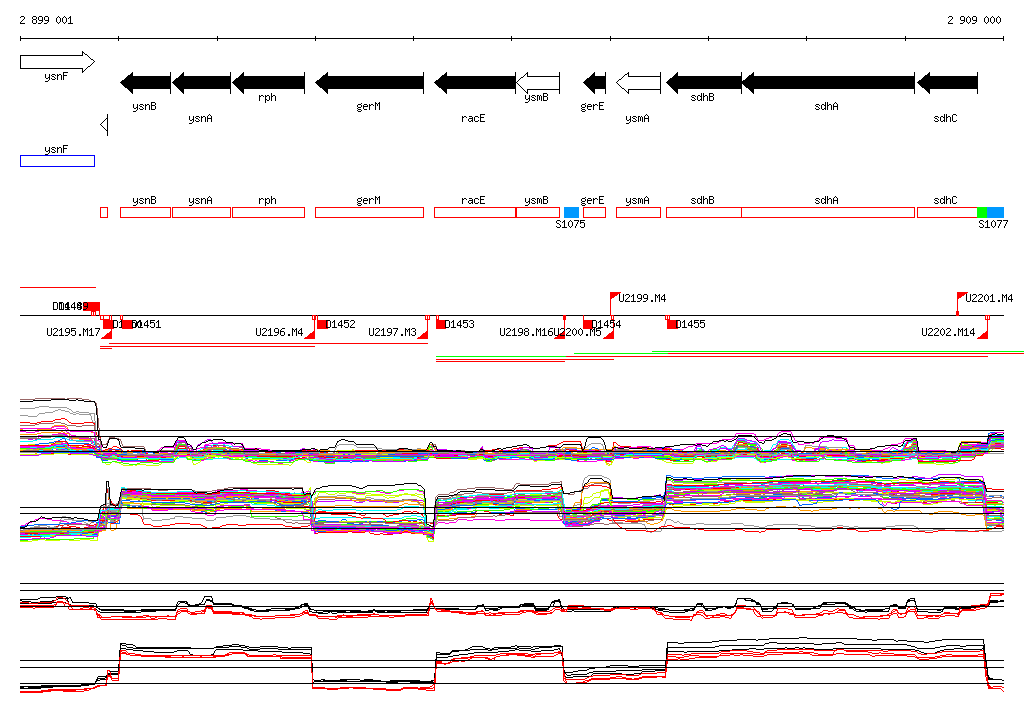
Genomic View of Gene/Segment gerE
Show/Hide
(Legend)
Browse Genome Context