| Start Page |
|
 |
| Start Page |
|
|
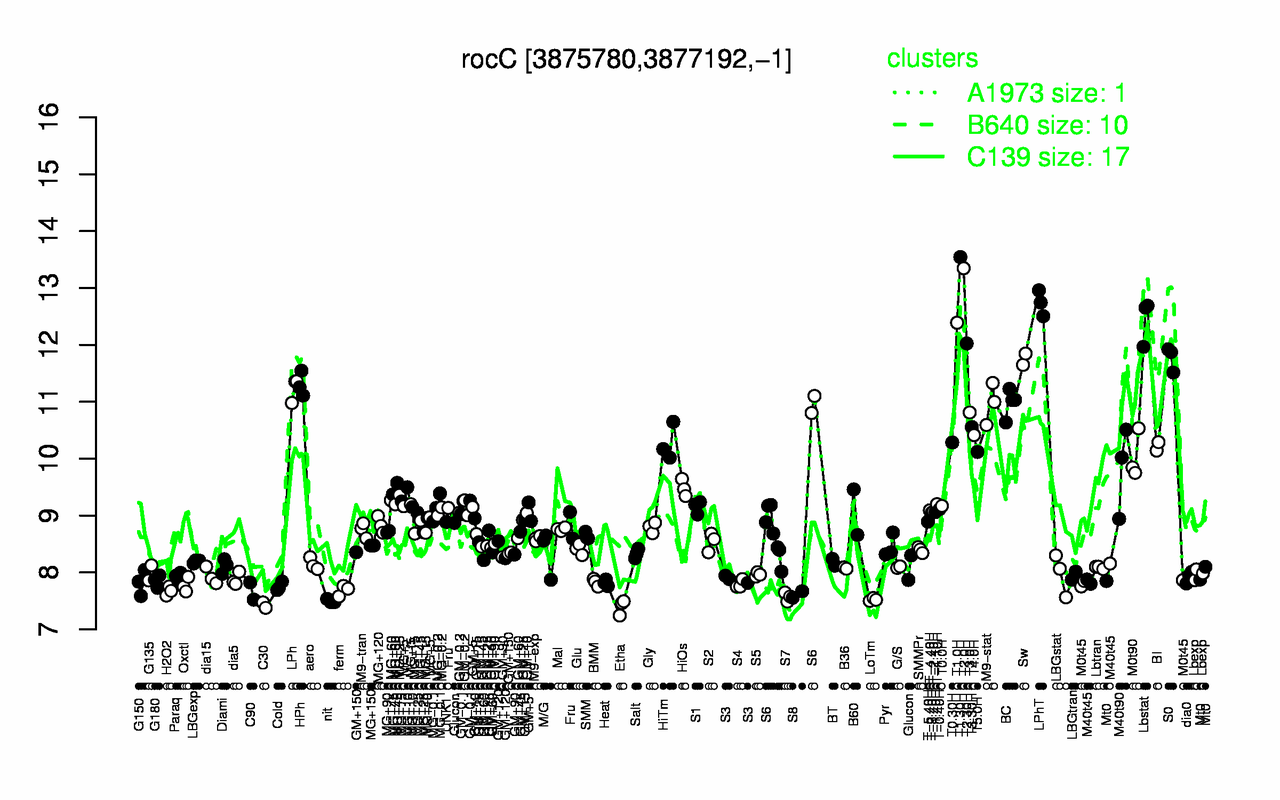
| T1.30H | T2.0H | LPhT | Lbstat | T1.0H | T2.30H | S0 | Sw | HPh | LPh |
| 13.5 | 13.3 | 12.7 | 12.4 | 12.4 | 12 | 11.8 | 11.7 | 11.3 | 11.2 |
| Etha | C30 | nit | LoTm | S7 | S8 | C90 | H2O2 | ferm | Cold |
| 7.4 | 7.43 | 7.5 | 7.52 | 7.57 | 7.61 | 7.67 | 7.67 | 7.69 | 7.75 |