B. subtilis Expression Data Browser
Details about NA Show/Hide
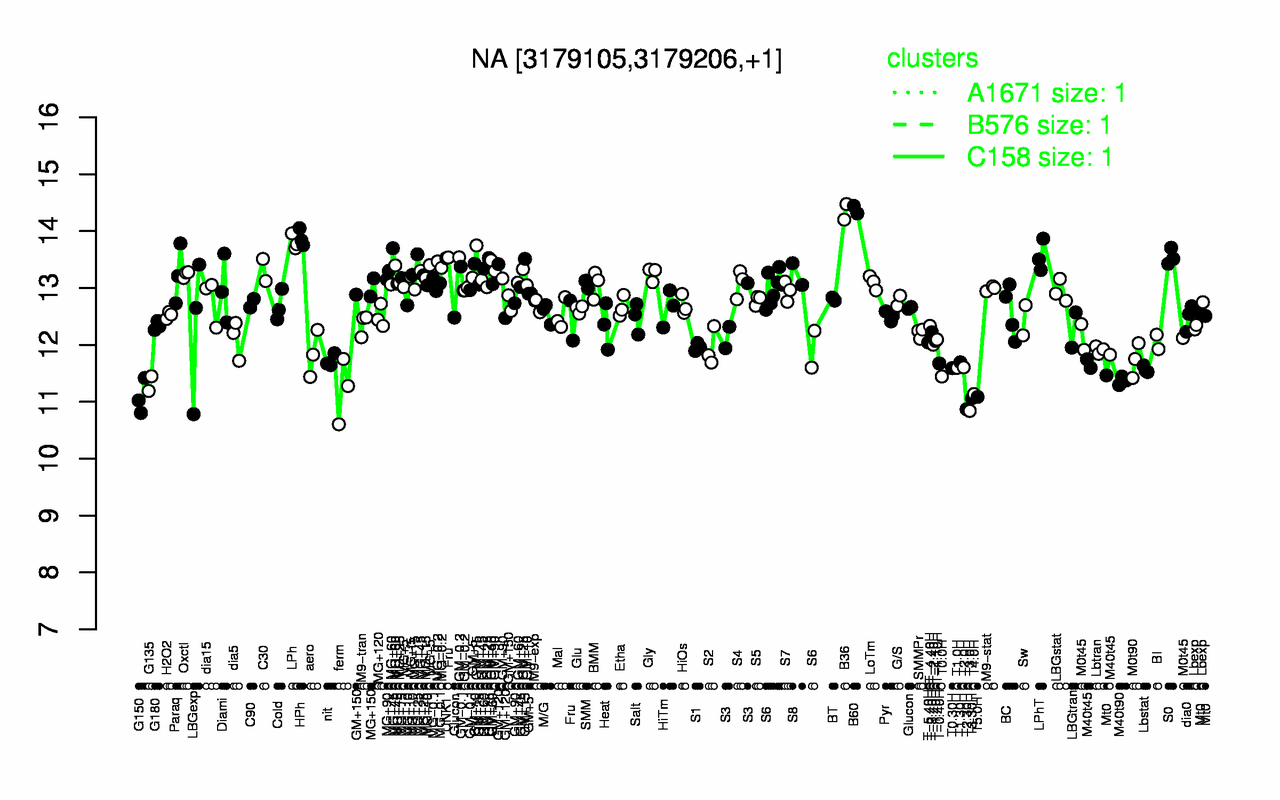
Highest Expression Conditions
B60 B36 HPh LPh GM+15 LPhT S0 UNK1 MG-0.2 MG+45
14.4 14.3 13.9 13.8 13.6 13.6 13.5 13.5 13.4 13.4
Lowest Expression Conditions
T3.0H T2.30H T3.30H G150 T5.0H T4.0H ferm G135 M40t90 T0.0H
10.8 10.9 11.1 11.1 11.1 11.1 11.2 11.3 11.4 11.4
Most Positively Correlated Segments
NA NA NA NA NA S189 thiT ydfM S308 rpmEA
0.62 0.57 0.54 0.54 0.52 0.52 0.5 0.49 0.48 0.48
Most Negatively Correlated Segments
cycB S360 rapD ganP mntA kbaA S1526 ganQ mmsA iolF
-0.5 -0.49 -0.49 -0.48 -0.48 -0.48 -0.47 -0.47 -0.47 -0.47
Expression Profile of Segment NA Show/Hide
Genomic View of Gene/Segment NA Show/Hide
(Legend)